What is Enterprise Website Analytics?

Table of Contents
Enterprise website analytics is the process of using advanced data analysis tools to collect, measure, analyze, and interpret large volumes of data from an organization’s website to identify bottlenecks in the user journey, improve website design and functionality, and provide businesses with actionable insights for decision-making at scale.
It lets businesses optimize audience engagement by tracking user behavior, monitoring website performance, and analyzing marketing effectiveness.
Enterprise website analytics encompasses descriptive, diagnostic, predictive, and prescriptive analytics, leveraging data analysis techniques to summarize historical data, identify user behavior patterns, forecast future trends, suggest marketing strategies or website design changes, and promptly respond to traffic spikes or sudden drop-offs.
Using insights gained with the help of enterprise website analytics, web analysts, data scientists, UX researchers, and marketing specialists can collaborate to ensure accurate data collection and interpretation.
Using tools like Google Analytics, Hotjar, Mixpanel, Adobe Analytics, and Amplitude, they track user interactions, diagnose technical issues, and measure marketing campaign effectiveness.
Why is Enterprise Analytics Important?
Enterprise website analytics is important because it provides businesses with raw data, which can be further analyzed and transformed into actionable insights, improving decision-making, optimizing operations, and uncovering new opportunities. By identifying hidden trends and patterns, companies gain a competitive edge and drive smarter strategies.
Without analytics, companies would be operating blindly, unable to measure success or identify areas for improvement.
The data collected through website analytics includes various types, each serving a specific purpose:
- User interaction data (such as page visits, time spent on-site, and conversion rates) helps businesses understand customer behavior, identify friction points, and improve website navigation.
- Performance metrics (page load speed, server response times, and mobile responsiveness) ensure the site runs smoothly and meets industry standards.
- Marketing data (such as traffic sources, ad campaign performance, and engagement rates) helps companies refine their strategies and allocate budgets effectively.
While collecting and analyzing user data, businesses must ensure compliance with regulations like GDPR and CCPA to protect user privacy, maintain trust, and uphold ethical data practices.
Compliance & Data Privacy
As businesses track user interactions, they must ensure data collection and processing comply with legal regulations. These include the General Data Protection Regulation (GDPR, EU Regulation 2016/679) and the California Consumer Privacy Act (CCPA).
Compliance requires transparency in how personal data is used, identifying potential risks, and taking proactive measures to protect consumer privacy.
- GDPR requires companies to obtain user consent before collecting data, ensure transparency in data usage, and provide users with the right to access or delete their information.
- CCPA grants California residents similar rights, allowing them to know what data is collected, request its deletion, or opt out of data sales.
Failure to comply can lead to hefty fines, legal actions, and reputational damage.
What Does Enterprise Analytics Focus On?
Enterprise analytics focuses on three core areas — user behavior, website performance, and digital marketing effectiveness — because together, they provide extensive insights into a website’s performance and effectiveness, covering user interaction, technical health, traffic sources, and marketing campaign performance.
User Behavior
User behavior analysis is focused on understanding how visitors interact with a website, how often they engage with specific calls to action, the time spent on pages, scroll depth, form submissions, and navigation paths.
When analyzing user behavior, the goal is to identify areas on a website that cause confusion and leverage that information to improve navigation and usability. User behavior analysis helps businesses identify bottlenecks in conversion funnels and address those to maximize the likelihood of users taking specific actions.
For instance, if a website has a high bounce rate (the percentage of users who only viewed a single web page before leaving a website), it could indicate content or user experience issues on the landing page. By analyzing this metric through user behavior, businesses can identify areas for improvement and increase user engagement.
Based on the findings from user behavior analysis, companies gain insights into what users do and why. When combined with website performance analysis, businesses can assess how well the site supports those behaviors.
Website Performance
Website performance analysis focuses on identifying technical issues that affect user experience, such as slow load times, broken pages, malfunctioning pop-ups, inactive buttons, or unresponsive forms. These issues often manifest through low conversion rates, short time on page, and high bounce rates.
Unlike user behavior analysis, which helps businesses understand their audience, website performance metrics pinpoint backend and frontend inefficiencies. Poor performance data often signals the need to collaborate with web developers to resolve technical problems hindering user engagement and conversions.
For example, if users abandon a site due to slow-loading pages, performance metrics like average page load time, time to first byte (TTFB), first contentful paint (FCP), Speed Index, Cumulative Layout Shift (CLS), and bounce rate help identify the cause.
Website performance analysis detects friction points like delays and poor navigation. Businesses can enhance the user experience by fixing these issues, while A/B testing optimizes design, content, and calls-to-action to improve engagement and conversions.
Website performance analysis forms the foundation for assessing digital marketing success, as it directly impacts user experience, conversions, and engagement — key metrics for campaign effectiveness.
Digital Marketing Campaigns Performance
Digital marketing campaign performance analysis focuses on metrics like traffic sources, conversion rates, bounce rates, and the return on investment (ROI) of paid campaign to assess marketing effort effectiveness.
It helps identify high-performing campaigns, optimize strategies, and drive valuable traffic, engagement, and conversions for improved marketing results.
By analyzing digital marketing campaign performance, enterprises can identify which channels — email, social media, paid ads, or SEO — drive the most traffic and conversions, enabling better resource allocation.
Digital marketing campaign performance analysis involves studying user interactions. With its help, companies can better understand how users interact with CTAs, form submissions, social sharing buttons, and other on-site elements.
For example, if an enterprise notices that a paid ad campaign is driving high traffic but has a low conversion rate, they can analyze user behavior on landing pages to identify potential issues — such as slow load times, unclear messaging, or ineffective calls-to-action — and make data-driven adjustments to improve results.
To wrap up the discussion on the key areas of enterprise analytics, it’s worth noting that by focusing on all three major areas and integrating insights from them, enterprises can make data-driven decisions to drive engagement, conversions, and overall business success.
5 Types of Enterprise Website Analytics
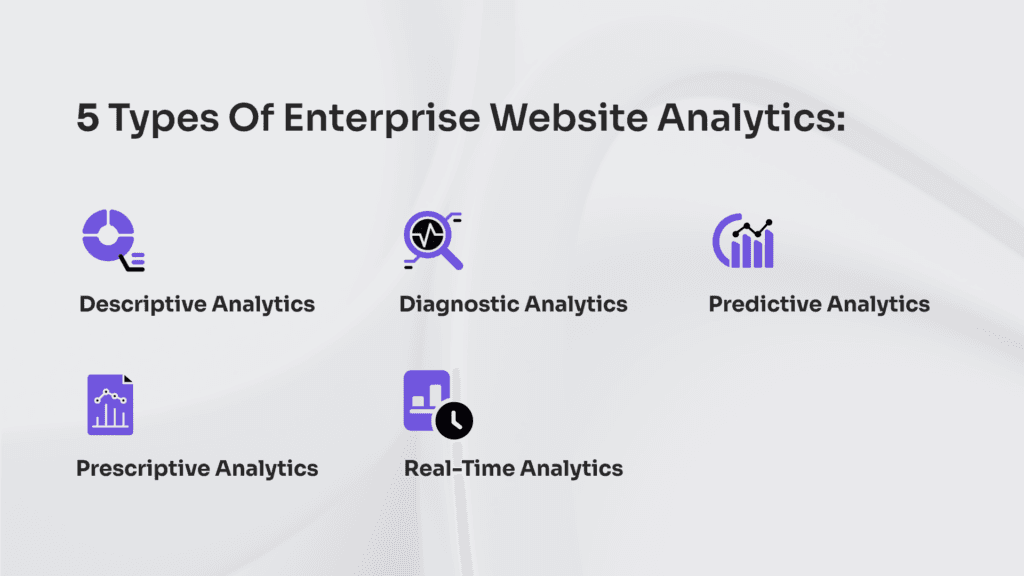
1. Descriptive Analytics
Descriptive analytics (or historical analytics) focuses on summarizing historical data (such as website traffic, user interactions, and sales) to understand past performance.
This type of analytics typically uses metrics such as total sales, website traffic, customer acquisition cost, average order value, year-over-year sales growth, customer retention rate, and any metric that describes what happened in the past, focusing on “what” and “how many” without attempting to predict future trends.
Business analysts and marketing teams use this data to inform strategic decisions about content or marketing campaigns.
For example, Google Analytics can track the number of users visiting the website over a specific period. A business analyst might use this data to determine the most visited pages, such as a blog post or product page, helping marketers focus on high-performing content.
2. Diagnostic Analytics
Diagnostic analytics (troubleshooting or causal analysis) is designed to explore the reasons behind past events or outcomes.
It digs deeper into data to identify patterns and causes, answering questions like, “Why did my website traffic drop last week?” or “What caused the high bounce rate on this product page?”
This type of analysis often involves comparing various metrics, such as conversion rates, funnel drop-offs, and user engagement, to understand how different factors contribute to performance.
Product managers, web analysts, and UX designers typically use diagnostic analytics to identify user experience or business performance issues.
For example, Hotjar provides heatmaps and session recordings that help businesses analyze user behavior and understand why users abandon shopping carts. If users click on a product but do not complete the purchase, a team might discover an issue with the checkout process, such as confusing navigation or slow load times.
3. Predictive Analytics
Predictive analytics (advanced or future-oriented analytics) uses historical data and statistical algorithms to forecast future outcomes or trends.
The goal is to anticipate what will happen next, answering questions like, “What is the likelihood that a user will convert?” or “Which marketing campaign will yield the highest ROI?”
Marketing teams, data scientists, and product managers use predictive analytics to drive decisions on customer segmentation, marketing strategies, and resource allocation.
Predictive analytics can analyze user behavior, conversion rates, and sales data to forecast which customers are most likely to purchase in the next month. This helps businesses allocate resources and optimize strategies accordingly.
For example, Adobe Analytics can predict the likelihood of a user completing a purchase based on their interactions with the website.
By analyzing past behavior, Adobe Analytics identifies a segment of users who frequently browse products but rarely convert, suggesting targeted marketing campaigns to increase conversions.
4. Prescriptive Analytics
Prescriptive analytics (or actionable analytics) uses data, algorithms, and simulations to suggest the best action, answering questions like, “What should we do next to increase conversions?” or “How can we optimize our marketing efforts for better results?”
Prescriptive analytics analyzes data from various sources, such as user behavior, website performance, and marketing campaigns, to recommend actions based on predicted outcomes. It often incorporates machine learning models or optimization algorithms to suggest decisions to improve future performance.
Marketing teams, UX designers, and product managers rely on prescriptive analytics to make data-driven decisions to improve user engagement, increase conversion rates, and optimize the website’s overall performance.
For example, using Amplitude, an e-commerce company may see that users who view product reviews are more likely to make a purchase. Prescriptive analytics might suggest improving the visibility of customer reviews on key product pages, helping to increase conversion rates.
5. Real-Time Analytics
Real-time analytics (streaming or live analytics) focuses on the immediate collection, analysis, and reporting of data as it is generated. It provides live insights into user behavior, site performance, and ongoing digital marketing efforts.
This type of analytics answers questions like, “How is the current user session performing?” or “Are there any issues impacting the website experience right now?”
Real-time analytics processes data continuously from user interactions, website traffic, and server performance, providing instant insights into what’s happening at the moment.
Web developers and marketing teams benefit from real-time analytics, which allow them to make quick decisions about site optimization, content delivery, and user engagement strategies.
Real-time analytics requires scalable infrastructure built by developers to ensure data is processed and delivered instantly without performance bottlenecks. Developers work to create this responsive framework to enable businesses to react in real time.
For example, in Mixpanel, real-time data can reveal if a user encounters an error during checkout. This lets the team respond immediately by fixing the issue or providing real-time customer support, thus preventing lost sales.
To better understand the differences between the various types of enterprise website analytics, here’s a comparison table summarizing their purposes, the data they analyze, example tools, and key metrics.
| Analytics Type | Purpose | Data Used | Example Tools | Key Metrics |
| Descriptive Analytics | Provides insights into historical data | User behavior, website traffic, conversions | Google Analytics, Amplitude | Bounce rate, traffic sources, pages per session |
| Diagnostic Analytics | Identifies the causes of past performance issues | User interaction data, performance logs | Hotjar, Adobe Analytics | Conversion drop-offs, error tracking, user flow |
| Predictive Analytics | Forecasts future trends and behaviors | Historical data, user behaviors, patterns | Mixpanel, Adobe Analytics, Amplitude | Conversion rate, churn rate, customer lifetime value |
| Prescriptive Analytics | Recommends actions to optimize outcomes | User behavior, marketing data, performance metrics | Google Analytics, Amplitude | Conversion optimization, marketing ROI, user engagement |
| Real-Time Analytics | Provides immediate insights for real-time decision-making | Live user interactions, system performance | Hotjar, Mixpanel, Google Analytics | Active users, real-time conversion rate, page load time |
Who Works with Enterprise Analytics?
Web analysts, data scientists. UX designers, marketing specialists, web developers, DevOps engineers, and business intelligence analysts work with enterprise analytics to ensure the effective collection, analysis, and application of data across the organization.
- Web Analysts collect and interpret website data. They analyze user behavior, website performance, and traffic sources to identify trends, opportunities, and areas for improvement.
- Data Scientists work with larger, more complex datasets. They use advanced statistical techniques, machine learning, and predictive analytics to extract actionable insights, identify patterns, and forecast trends that can guide business decisions.
- UX Designers focus on how users interact with a site, using data to optimize the platform’s design, navigation, and overall usability.
- Marketing Specialists use the insights gained from enterprise analytics to inform and optimize digital marketing campaigns. They track the effectiveness of different strategies, segment audiences, and refine marketing efforts to improve conversion rates and customer acquisition.
- Web Developers are responsible for properly implementing tracking codes and analytics tools. They work closely with analysts to ensure accurate data collection and troubleshoot any technical issues that may arise during the tracking process.
- DevOps Engineers manage the data pipelines and infrastructure that support enterprise analytics. They ensure the flow of data from various sources is seamless, secure, and available in real-time for analysis, enabling teams to make timely, data-driven decisions.
- Business Intelligence Analysts focus on transforming data into meaningful insights for decision-making. They work with structured and unstructured data to help businesses track KPIs, identify growth opportunities, and optimize operations.
Enterprise website analytics relies on cross-functional collaboration.
For instance, developers ensure the proper integration of tracking tools, while marketers use the insights to optimize their campaigns. UX designers apply behavior insights to enhance the website’s design and user experience, creating a seamless flow for customers.
Top 5 Enterprise Website Analytics Tools
1. Google Analytics
Google Analytics is one of the most widely used analytics tools that provide insights into website traffic, user behavior, and overall site performance. It allows businesses to track and analyze how visitors interact with their website, including detailed demographic data and acquisition channels.
Google Analytics integrates with several other tools, such as Salesforce, HubSpot, Zoho, Microsoft Dynamics, Pipedrive, and Sage CRM, enabling a better understanding of user interactions and their journey through website and sales funnels.
Key functionality:
- Track website traffic. Monitor user sessions, page views, and other key traffic metrics to measure website performance.
- Analyze user behavior. Understand how users navigate your website, including their engagement with specific pages, content, and features.
- Measure conversions. Set up goals to track specific actions on your website, such as form submissions, downloads, and purchases.
- Audience segmentation. Create segments of users based on demographics, behaviors, and acquisition sources to tailor marketing efforts.
- Real-time reporting. Get instant access to live data, including how many users are on your site and what pages they’re viewing.
Pros:
- Provides detailed and customizable reporting options.
- Integrates with Google tools and third-party platforms.
- Uses AI-driven insights for automated decision-making.
Cons:
- Requires expertise in advanced configurations and reporting.
- The standard version has data sampling limitations.
- The premium version (Google Analytics 360) is expensive for small businesses, starting at around $50,000 annually.
2. Hotjar
Hotjar is a behavior analytics tool that provides insights through heatmaps, session recordings, surveys, and feedback polls, helping businesses understand how users interact with their websites.
Unlike traditional analytics tools focusing on numbers and trends, Hotjar emphasizes qualitative data, revealing why users behave the way they do.
Hotjar connects with Salesforce and Zoho CRM, allowing you to connect user behavior data from Hotjar directly with contact information within your CRM, providing deeper insights into customer interactions on your website.
Key functionality:
- Track user interactions. Capture heatmaps to visualize where users click, scroll, and hover.
- Record user sessions. Replay visitor journeys to identify friction points and usability issues.
- Collect feedback. Use on-site surveys and feedback widgets to understand user preferences and frustrations.
- Analyze conversion funnels. Identify drop-off points in the customer journey and optimize key pages.
- Monitor form performance. Detect where users abandon forms to improve completion rates.
Pros:
- Provides visual insights that complement traditional analytics tools.
- Easy to install and use without technical expertise.
- Offers direct user feedback for actionable improvements.
Cons:
- Lacks deep data analysis compared to tools like Adobe Analytics or Google Analytics.
- Limited real-time tracking capabilities.
- It can impact website performance if not configured properly.
3. Mixpanel
Mixpanel is a product analytics tool that lets companies track and analyze user interactions with their web and mobile apps. It offers insights into user behavior, allowing businesses to understand customer journeys, measure engagement, and identify areas for optimization.
The tool focuses on event-based tracking, allowing users to define custom events to monitor specific actions within the product. It offers robust segmentation based on demographics, behavior, or event triggers to target specific user groups effectively.
Mixpanel integrates with various tools, most notably HubSpot, Salesforce, and Zoho CRM. It allows you to sync user behavior data from Mixpanel with customer information in your CRM.
Key functionality:
- Track events. To understand user engagement, capture specific actions like clicks, sign-ups, and purchases.
- Analyze funnels. Visualize conversion rates and identify where users drop off in key processes.
- Segment users. Group users based on behaviors, demographics, or lifecycle stages for tailored marketing campaigns.
- Monitor retention. Measure user retention over time and identify the factors that drive long-term engagement.
- Run A/B tests. Test variations of product features or marketing messages to optimize performance.
Pros:
- Provides granular event tracking and advanced segmentation features.
- Enables real-time insights, allowing for quick adjustments to marketing and product strategies.
- Integrates well with other platforms like Google Analytics and HubSpot.
Cons:
- Steep learning curve for new users due to its advanced features.
- Can become expensive for larger data volumes or premium features (custom pricing for the enterprise plan starts at $1,667/month for 5M-1B+ events/month).
- Lacks built-in data visualization tools compared to competitors, like Google Analytics, Adobe Analytics, and Amplitude.
4. Adobe Analytics
Adobe Analytics is an enterprise-level tool designed to help businesses collect data on customer interactions and refine marketing efforts. It offers advanced segmentation, allowing enterprises to categorize and analyze customer data based on specific characteristics and behaviors and integrate it with other Adobe marketing tools within the Adobe Experience Cloud.
The integration with other Adobe Experience Cloud products, such as Adobe Target, Adobe Experience Manager (AEM), and Adobe Campaign, allows marketers to access customer data from various touchpoints in a single platform, react quickly to customer behavior, and make informed decisions based on live insights.
Key functionality:
- Track customer journeys. Monitor and visualize customer behaviors across multiple channels, providing a comprehensive view of the entire customer experience.
- Create custom reports. Design tailored reports based on specific data points such as traffic, engagement, and conversions.
- Segment audiences. For more targeted campaigns, use advanced segmentation to group customers by demographics, behaviors, or purchase intent.
- Predict future behavior. Leverage machine learning and predictive analytics to anticipate customer actions and improve decision-making.
- Monitor marketing performance. Track the effectiveness of marketing campaigns and identify opportunities for optimization.
Pros:
- Offers advanced segmentation and customization options for in-depth analysis.
- Seamlessly integrates with other tools in the Adobe Experience Cloud for a comprehensive marketing and analytics strategy.
- Provides predictive analytics and machine learning features to optimize customer engagement.
Cons:
- Expensive pricing model, making it more suitable for large enterprises, with costs often reaching well into the six figures per year.
- Requires technical expertise for proper setup and full utilization of its features.
- Can be overwhelming for smaller teams due to its complex capabilities and extensive features.
5. Amplitude
Amplitude is a digital analytics tool categorized as a “product analytics” platform. It is widely used by product teams, marketers, and analysts to understand user behavior within a product by tracking user interactions and events. This provides insights for improving customer experience and identifying key drivers of retention and conversion.
Amplitude can integrate with HubSpot, allowing you to sync user behavior data from Amplitude into your CRM platform to understand customer interactions better and optimize sales and marketing efforts based on product usage insights.
Key functionality:
- Analyze user behavior. Track user interactions across websites to understand how they engage with products and content.
- Segment users. Segment users by behavior, demographic data, or lifecycle stages to create dynamic user segments and tailor marketing campaigns based on specific actions and characteristics.
- Measure user retention. Track how many users return after a specific interaction to uncover retention-driving factors.
- Cohort Analysis:
Analyze cohort behavior. Track user activity within defined groups to identify trends based on acquisition time or other criteria. - Custom Dashboards:
Create personalized dashboards. Build customized views with essential metrics and visualizations to monitor product performance and identify trends.
Pros:
- Offers robust behavioral analytics, providing granular insights into user interactions and engagement.
- Provides powerful segmentation and cohort analysis to let marketers create campaigns based on specific user segments.
- It easily integrates with other tools, such as HubSpot, enabling a comprehensive view of customer data.
Cons:
- The learning curve can be steep for beginners due to its extensive features and advanced capabilities.
- Advanced features require a premium plan, which can be cost-prohibitive for smaller businesses or startups (the Growth plan starts at around $995 per month).
- While powerful for product analysis, it may lack some in-depth website traffic analysis features compared to other tools like Google Analytics.
How to Create an Enterprise Web Analytics Strategy?
To create an effective enterprise web analytics strategy, follow these 10 key steps:
Step 1: Define KPIs aligned with business objectives. Focus on metrics like revenue growth, customer retention, or user acquisition to ensure you’re tracking the most important outcomes.
Step 2: Choose the right analytics tools for your needs. Consider tools like Google Analytics, Adobe Analytics, and Hotjar to effectively track performance, user behavior, or marketing campaigns.
Step 3: Segment your audience for more targeted analysis. Group users based on demographics, behaviors, and traffic sources to better understand campaign effectiveness and optimize the user experience.
Step 4: Partner with developers to deploy tracking codes. Ensure relevant tracking codes, such as Google Analytics or event tracking, are properly implemented across all website pages.
Step 5: Set up data collection parameters to track key metrics. Define parameters like page views, clicks, conversions, or form submissions, ensuring they align with KPIs for accurate insights.
Step 6: Develop a reporting structure for effective communication. Create a clear plan for how often reports are generated, who reviews them, and how the data is presented (dashboards, written summaries, etc.).
Step 7: Analyze data to identify trends and insights. Examine website performance, user behavior, and marketing campaign success to uncover areas for improvement and actionable takeaways.
Step 8: Optimize based on insights. This could involve changes to site content, layout, or performance enhancements. Test changes using A/B testing and track improvements through your analytics tools.
Step 9: Continuously align with evolving business goals. Regularly adjust KPIs and data collection methods to ensure your strategy remains relevant and aligned with new business objectives.
Step 10: Collaborate with cross-functional teams to ensure integration. Work closely with marketing, UX/UI designers, and product managers to incorporate analytics insights into broader business strategies.
What Are the Key Analytics Metrics?
Key analytics metrics include:
- Conversion rate. The percentage of visitors who complete a desired action, such as making a purchase or signing up for a newsletter, out of the total number of visitors.
- Engagement rate. A measure of how actively users interact with content, often used on social media. It’s calculated by dividing the number of interactions (likes, comments, shares) by total impressions.
- Pages per session. The average number of pages a visitor views during a single website session.
- Average time on page. The average amount of time a visitor spends on a particular page.
- Bounce rate. The percentage of visitors who leave a website after viewing only one page.
- Customer acquisition cost (CAC). The total cost of acquiring a new customer, including marketing and sales expenses.
- Returning visitors. The percentage of visitors who have previously visited the website.
- Lifetime value (LTV). The total revenue a customer is expected to generate throughout their relationship with a company.
- Churn rate. The percentage of customers who stop doing business with a company within a given period
Does a Well-Developed Website Improve Key Analytics Metrics?
Yes, a well-developed website significantly improves key analytics metrics such as bounce rate, conversion rate, pages per session, and average time on page.
A well-structured website with clear navigation, fast loading speeds, and an intuitive design helps reduce bounce rates and encourages users to stay longer.
A website that facilitates purchases, sign-ups, or form submissions through a smooth and intuitive experience drives higher conversion rates. Clear calls to action (CTAs), streamlined checkout processes, and compelling content make it easier for visitors to take the next step.
All these metrics are optimized through web development for enterprise. Developers ensure the website is responsive, loads quickly, and offers a smooth user experience, ultimately leading to higher engagement and conversion.


Contact
Don't like forms?
Shoot us an email at [email protected]

Send a Project Brief
You need to load content from reCAPTCHA to submit the form. Please note that doing so will share data with third-party providers.
More InformationYou are currently viewing a placeholder content from Turnstile. To access the actual content, click the button below. Please note that doing so will share data with third-party providers.
More InformationYou are currently viewing a placeholder content from Facebook. To access the actual content, click the button below. Please note that doing so will share data with third-party providers.
More InformationYou are currently viewing a placeholder content from Instagram. To access the actual content, click the button below. Please note that doing so will share data with third-party providers.
More InformationYou are currently viewing a placeholder content from X. To access the actual content, click the button below. Please note that doing so will share data with third-party providers.
More Information