A/B Testing – Complete Guide

Table of Contents
A/B testing compares two versions of a WordPress website to determine which performs better. It enables controlled exposure of different user segments to each variant, allowing the website to measure behavioral responses and conversion signals.
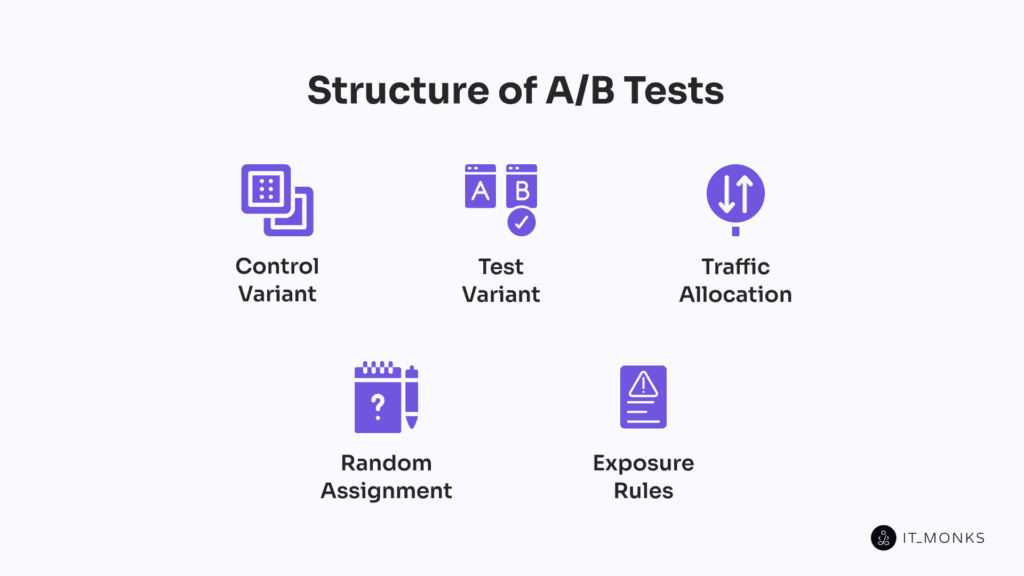
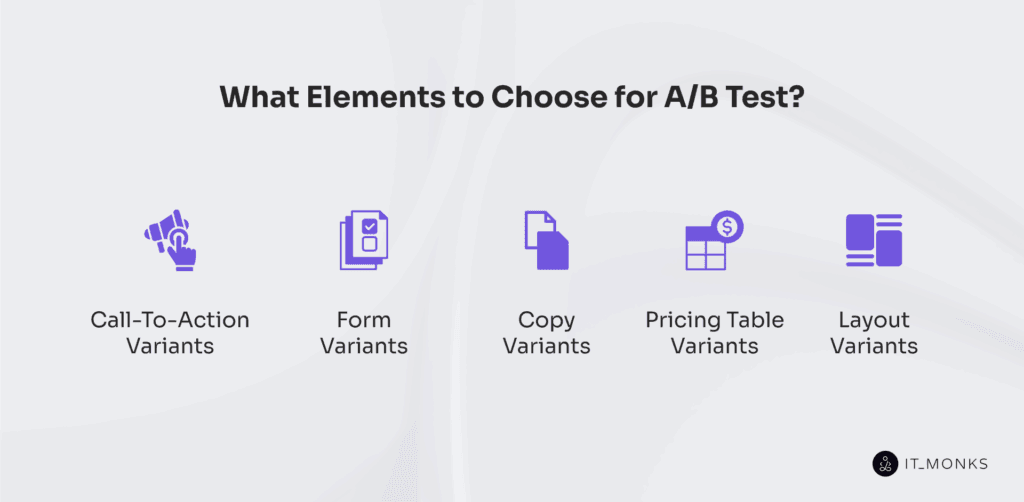
In this framework, A/B testing involves contrasting a control variant with a test variant, defining exposure rules, distributing traffic into traffic buckets, and integrating random assignment so that each user sees the correct variant. This structure influences which elements, such as CTA, form, copy, pricing-table, and layout variants, are selected for testing.
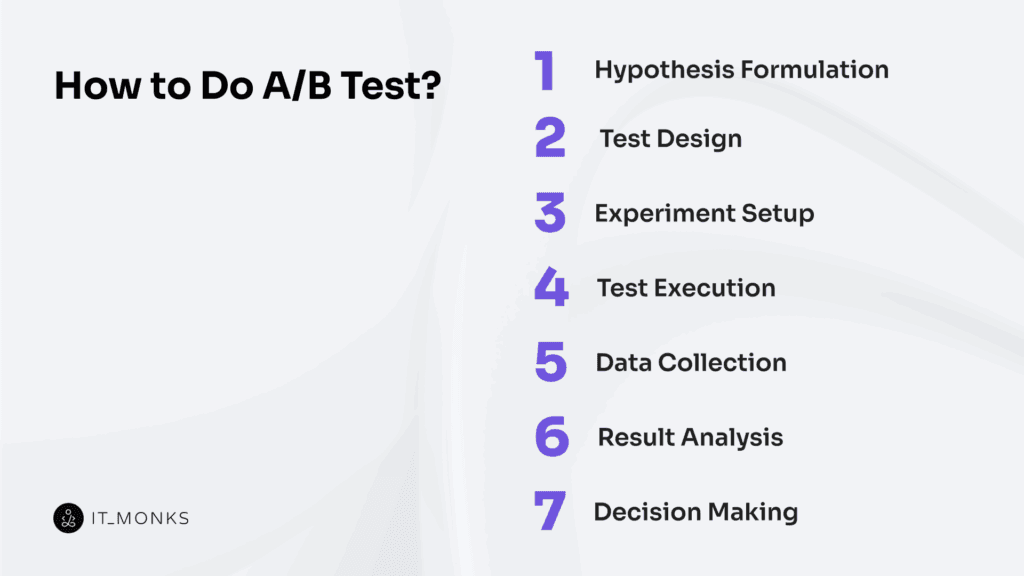
A/B testing follows a simple workflow: a hypothesis defines the expected change in the interaction metric, test design specifies how the variants behave, experiment setup integrates the plugin framework, execution influences user actions, data collection evaluates interaction metrics, and analysis determines which variant meets the visibility threshold and produces the stronger conversion signal.
A/B testing also integrates with the WordPress plugin framework and site structure to enable efficient test deployment. The evaluation cycle informs UX decisions, drives design updates with measurable results, and assesses SEO effects as visibility interacts with indexing and performance.
A WordPress website improves experimentation efficiency through plugin support, theme compatibility, and controlled site structure that enable low-friction A/B testing across content and interface components.
What is A/B Testing?
A/B testing is a controlled-experimentation method that compares a control variant and a test variant of a webpage to identify which version drives higher conversion rates.
In practice, A/B testing segments users into a control group and a test group, evaluates differences in behavior using defined metrics, and applies random assignment, traffic allocation, and statistical analysis to ensure reliable performance outcomes.
Within a WordPress website, A/B testing can be integrated via plugin configuration, script-based experiment logic, or theme-level conditional rendering to expose users to different variant states.
Through this implementation structure, WordPress can track user behavior across CTAs, forms, copy, and layout components and determine how each modification affects measurable performance outcomes.
By operating within WordPress development workflows, A/B testing guides data-driven decisions that improve UX, enhance site performance, and support SEO by validating interaction patterns.
Structure of A/B Tests
A/B test structure defines the experimental framework for a WordPress website, ensuring that variant evaluation is consistent, measurable, and repeatable. It organizes user segmentation, variant delivery, and behavior measurement so that results reflect a controlled change rather than uncontrolled variation.
Because this framework must ensure reliable comparisons, it standardizes test execution across configuration layers by controlling how control and variant configurations are defined, how traffic is allocated, how random assignment is performed, and how exposure rules are applied.
Without this structure, experiment integrity and result reliability fail. It also governs how segmentation, variant exposure, and measurement operate together as coordinated components.
Within a WordPress environment, A/B testing is implemented via plugins, shortcodes, and block-based experiment managers. These tools apply the segmentation rules, variant-exposure logic, and measurement steps directly during page load, ensuring the A/B test runs correctly for every user.
The structure typically includes a defined control, one or more variants, traffic allocation logic, randomized assignment, and exposure rules.
Control Variant
The control variant is the unchanged, current live version of the webpage or element used as the test baseline in an A/B experiment. It remains stable during the test and serves as the reference point for evaluating how the test variant performs.
This stable version anchors the performance comparison. Because it remains unchanged, any measured performance difference can be attributed to the modification in the test variant rather than random variation. Without a reliable control, the experiment cannot determine whether the variant performs better, worse, or the same.
In a WordPress setup, the control is typically the current version of the page template, CTA, or layout that most users see. Compared to the control, the test variant introduces the change used to measure its impact,
Test Variant
The test variant is the modified version of a page or element that introduces a single, intentional change defined by the test hypothesis. This version isolates one adjustment, such as a visual, text, or functional change, to test whether the modification influences user behavior and validates whether performance improves or declines.
Because its purpose is to measure the effect of a specific change, the test variant becomes meaningful only when compared to the control. This isolated modification shows how the adjusted element affects actions such as clicks, form submissions, or purchases.
In WordPress, a test variant is typically created with A/B testing plugins or by duplicating a page and applying controlled edits. These workflows allow site owners to evaluate proposed changes while maintaining stable site behavior for most users.
Once the variant is created, the next step is to expose both versions to real traffic, which leads directly to the next step: defining traffic allocation and determining how visitors are distributed across variants.
Traffic Allocation
Traffic allocation determines how visitor distribution is split between the control and test groups by defining the exposure percentage each variant receives. A 50/50 traffic ratio is common because it allocates users evenly, supports balanced sampling, and improves data accuracy. WordPress site owners may use 70/30 or 90/10 splits to reduce risk or limit early exposure, but each group must receive enough users to ensure a sufficient sample size.
Once the ratio is set, WordPress A/B testing plugins distribute traffic according to that configuration, and the selected traffic ratio controls how quickly the experiment collects enough data to produce reliable results. An allocation that is too small or unbalanced can distort the sample and reduce data accuracy.
Traffic allocation only sets the planned split. To ensure the distribution is fair and unbiased, random assignment determines which visitor is assigned to each group.
Random Assignment
Random assignment controls who enters the control or test variant by assigning visitors at random. While traffic allocation sets the per-variant traffic allocation, random assignment determines which individual visitor is assigned to each group, preserving test integrity.
Random assignment avoids bias, prevents skewed exposure, and ensures equal-chance assignment across WordPress traffic. Without it, results may be distorted by time-based spikes, device differences, or intent variations, reducing data validity.
Most WordPress A/B testing plugins handle this automatically: once the allocation is set, the tool assigns visitors using randomized logic that maintains comparable groups.
After the assignment, the next step is to determine how consistently each visitor remains in the same variant, governed by exposure rules.
Exposure Rules
Exposure rules control how consistently a visitor sees the same variant after assignment. This consistency ensures variant stability, prevents cross-variant exposure, and maintains test validity by keeping the experience uniform across sessions. Without these rules, a visitor may see both versions, contaminating behavior data and weakening the experiment.
In WordPress environments, A/B testing plugins track and recall each visitor’s assignment using session-level or multi-session identifiers, which prevents returning users from being assigned to the same variant. Exposure rules also govern when exposure begins, whether repeat visits count, and how long the persistent assignment remains active.
By ensuring user-experience stability and preventing mixed exposure, exposure rules govern the integrity of the A/B testing environment and complete the structural setup before the experiment runs.
What Elements to Choose for an A/B Test?
Test elements should be selected based on how strongly they influence user decisions and how closely they align with the website’s goals. This approach guides a clear selection process rather than a generic list of items.
Not every element is worth testing; focus on the parts of the page users interact with most, or that directly support conversion actions. Factors such as visibility, behavioral signals (e.g., points where users hesitate or drop off), insights from heat map analysis, and alignment with key metrics should guide the selection process.
Building on these criteria, when selecting what to test, prioritize interaction zones, which are the areas users interact with most, high-visibility components, and elements that directly connect to measurable conversion relevance.
The decision should also reflect the specific problem or objective the test is meant to solve, whether it’s improving engagement, reducing bounce rate, or increasing sign-ups. In practice, while many sites prioritize commonly tested interface components, the right choice always depends on the site’s users and the site’s goals.
Call-to-Action Variants
Call-to-action elements are among the most frequently tested components in A/B testing because they operate at the conversion point where user intent becomes an action. Their impact is high because a CTA is a micro-interaction that determines whether the user completes a goal, such as submitting a form or completing a purchase.
Because this interaction is decisive, small design variations often produce measurable differences in engagement by adjusting how visible, clear, and motivating the action appears.
Changing the wording refines the decision cue; altering color or size affects perceptual prominence; shifting placement modifies interaction flow; and adjusting surrounding design influences how quickly the CTA is recognized as the primary action.
Form Variants
Forms are common A/B testing elements because they are positioned at a conversion bottleneck where small usability issues increase user friction and reduce form completion.
On WordPress sites where forms support lead generation, sign-ups, and checkout flows, A/B testing variants show which configuration reduces hesitation and increases completions. This provides an effective means of identifying measurable improvements in user behavior.
Typical variations focus on form usability: adjusting field count, reordering inputs, refining labels, changing optional vs. required logic, or running layout testing on spacing, grouping, and column structure. These adjustments clarify the task and reduce unnecessary effort.
Button placement and its proximity to the final field are also evaluated because they affect task clarity and completion behavior.
Copy Variants
Copy is one of the most frequently tested elements because small wording changes directly communicate value, clarify intent, and influence user decisions.
Short, action-oriented text can reframe how the offer is interpreted and how motivated users feel at key action points. Because these effects are measurable, copy variants are tested to see which wording produces the strongest behavioral response.
Testing copy variants determines which phrasing, tone, or structure most effectively motivates users. Teams compare headline clarity, call-to-action text, and tone and voice adjustments to see which version improves messaging clarity and aligns with user intent.
These comparisons extend across multiple text surfaces, not just primary headlines or CTAs.
Subheadings, button labels, and micro-descriptions are often adjusted to reduce ambiguity and strengthen the communication of value.
Common variants include alternate headlines, revised CTA labels, modified subheadings, and concise benefit-driven descriptions. Because copy is flexible and low-cost to change, it provides a high-leverage surface for identifying the wording that best communicates the purpose and drives measurable user response.
Pricing Table Variants
Pricing tables are a common A/B test element because their structure influences perceived value, guides plan selection, and clarifies how options are compared at the decision point.
Tests focus on presentation rather than price changes to improve decision-making support. As a result, A/B experiments typically evaluate how different visual or structural configurations affect user interpretation of the available plans.
To run these evaluations, variants often highlight specific plans, adjust feature emphasis, reorder columns for clearer price comparisons, or modify visual cues, such as badges or color accents, to highlight value tiers. These adjustments influence user confidence, reduce decision fatigue, and change upgrade or selection rates by making value distinctions more explicit.
Because these changes depend on flexible layouts and component control, WordPress block- or plugin-based pricing tables are well-suited to A/B testing. Their structure can be quickly adjusted, enabling controlled testing of layout, hierarchy, and emphasis across traffic segments.
Layout Variants
Layout variants are tested because the way a page structures and arranges elements directly guides user navigation, shapes content hierarchy, and influences attention flow.
In A/B testing, layout refers to the spatial organization of sections and functional blocks. Based on that structure, teams adjust variants by repositioning sections, changing column widths, modifying spacing, or shifting the content hierarchy to see how these changes affect how users locate actions and process information.
The goal is to improve readability, reduce navigation friction, and support a clearer path to conversion.
Testing alternative arrangements in a WordPress page builder, then identifying which layout flow maintains focus and improves task or conversion completion.
How to Do an A/B Test?
1. Hypothesis Formulation
Every A/B test begins with a clearly defined test hypothesis, a statement that predicts how a specific change will influence user behavior or a measurable outcome. The hypothesis is grounded in an observed issue, such as low conversions, drop-off, or weak click-through rates, and connects a proposed modification to an expected behavioral response.
A hypothesis defines the expected outcome, guides which element to test, and frames the test around a measurable user action. By relying on analytics, heatmaps, or funnel data, it also validates whether the resulting change conforms to the predicted response and prevents random or unfocused testing.
With the hypothesis established, the next step is to determine how the test will be structured, since this assumption directs the design of the control and variant conditions.
2. Test Design
Test design defines how the hypothesis is translated into a structured A/B experiment. Based on the hypothesis, the designer identifies the element to change, defines the control and variant, and structures the experiment so the modified variable is isolated while all other conditions remain constant.
The design specifies the test audience, aligns which users see each version, and defines the metrics that measure behavior change. Limiting the experiment to a single change ensures that performance differences can be attributed to that variable, supports reliable control-variant comparison, and reduces bias.
At the execution stage, WordPress tools may assist with implementation, but variable isolation, audience selection, and metric definition are determined during design. Once the design is finalized, the experiment can be configured and deployed.
3. Experiment Setup
With the design finalized, the experiment setup configures the planned test implementation and makes the A/B test operational. The control and variant are initialized through variant configuration inside the WordPress A/B testing tool, where their defined changes are applied and linked to the experiment.
From there, the system configures traffic rules to implement the planned traffic allocation, random assignment, and exposure constraints. Once traffic rules are in place, it initializes the tracking setup, links conversion goals, behavioral metrics, and any custom events defined during the design stage, enabling the experiment to capture complete data.
When the variant configuration, traffic rules, and tracking setup are validated, the experiment is prepared for deployment within the testing tool and is ready for execution and data collection.
4. Test Execution
Once the experiment is launched, the live test phase runs as users interact with the control and variant in real conditions. At this point, the system exposes users according to the configured assignment and traffic rules, and the test runs without interference.
During execution, the focus shifts to monitoring stability: verifying that pages load correctly, elements function correctly, tracking events are recorded accurately, and WordPress runtime behavior does not cause layout or caching issues.
To preserve stability, no design edits, tracking changes, or variant adjustments are made while the test is active. The author observes runtime behavior, ensures exposure rules maintain balanced traffic and random assignment, and confirms that assignment logic continues to operate as configured.
Although WordPress automates much of the underlying process, the site owner still checks frontend integrity, mobile responsiveness, and analytics accuracy to confirm consistent conditions.
After the test runs under stable conditions, execution transitions to data collection.
5. Data Collection
Data collection records and logs the performance metrics defined during test design for both the control and the variant under equal conditions. These metrics adhere to the conversion-tracking criteria and may include clicks, conversions, form submissions, scroll depth, and time on page, depending on the specific element being tested. This dataset forms the baseline for user behaviour analysis, ensuring that every captured interaction reflects real engagement patterns.
To ensure the data is reliable, attribution must remain accurate so the dataset reflects real behavioral differences instead of tracking noise. In WordPress, A/B testing plugins, analytics integrations, or event-based tools log and store structured interaction data throughout the test window.
At this stage of the process, no interpretation occurs; the goal is only to capture the data that underpins the test result. When sufficient reliable behavioral data have been collected, the process proceeds to result analysis.
6. Result Analysis
Once data collection is complete, the results are analyzed by comparing key performance metrics between the control and the variant. The analyst measures the performance metrics configured during the experiment setup in step 3 and evaluates whether the variant shows a meaningful improvement against the success criteria defined in the hypothesis.
After comparing these metrics, the analysis identifies stable patterns rather than early fluctuations or outliers and confirms that the sample size is sufficient to trust the outcome.
WordPress tools may provide comparison views or summaries, but the analyst must still interpret the data in relation to the hypothesis and verify whether the expected behavior occurred.
With this interpretation complete, the test outcome can be grounded in a full performance comparison, ensuring that decision making is based on accurate and reliable signals.
7. Decision Making
Once the analysis is complete, a decision must be made on how to apply the test outcome. Decision making implements the test outcome by determining whether the control is retained, the variant is adopted, or the hypothesis is rejected, and the experiment is iterated with refined parameters.
When the outcome is determined, the implementation decision applies the data-driven change to the live WordPress environment and evaluates alignment with the original hypothesis, predefined metrics, and site goals.
Based on this evaluation, the practical action depends on which version performs better. Once the variant performs consistently and measurably better, the site adopts it as the new default via theme, plugin, or content updates.
If the control performs better, the current version is retained, and the hypothesis outcome is documented. Even when results are unclear, the test still informs optimization by identifying weak signals or elements that require refinement.
Every decision must be recorded with its rationale, the metrics used for evaluation, and the action taken. This documentation supports the hypothesis feedback loop and feeds into the next optimization cycle, ensuring continuous iteration in WordPress environments where changes can be applied or reversed with low friction.
Analyzing and Interpreting A/B Test Outcomes
Interpreting A/B test outcomes bridges data and behavioral insight. It interprets not just which variant performed better but why the difference occurred and whether the result is reliable, forming a core part of conversion rate optimization.
A valid interpretation contextualizes the outcome against test conditions. It checks exposure consistency, stable audience size, and whether the duration captured full traffic cycles. This step validates that the outcome reflects a real behavioral shift rather than noise.
Once reliability is confirmed, interpretation explains what the result reveals about user behavior. A stronger variant reveals reduced friction or better relevance; a weaker variant exposes incorrect assumptions. Even inconclusive results reveal gaps between the hypothesis and actual user action.
Interpretation also depends on context. The same metric change may differ across segments, traffic sources, or goals. Proper analysis contextualizes the data within the broader strategy to avoid misaligned conclusions.
Each interpreted outcome informs the optimization loop. It guides hypothesis refinement, clarifies behavioral drivers, and informs future test design.
Why WordPress is Convenient for A/B Testing?
WordPress is well-suited for A/B testing because its structured workflow and flexible CMS, plugin ecosystem, and no-code editing tools support each stage. Site owners can create isolated variants in page builders or block editors, enabling quick, hypothesis-driven adjustments.
As the test moves into setup, WordPress simplifies this phase with plugin-based experimentation that manages traffic allocation, random assignment, and exposure rules. Its modular structure enables testing of specific templates, landing pages, or user roles.
During execution and tracking, WordPress integrates with analytics tools to capture clicks, form submissions, scroll depth, and conversions. It also supports custom event tracking when tests need more detailed signals.
When results are ready for evaluation, experiment data, variant comparisons, and publishing controls are available inside the CMS. Winning variants can be applied immediately through theme, block, or plugin layers.
Impact of A/B Testing on WordPress Site SEO
One common concern with A/B testing is its effect on SEO performance, especially when variants create duplicate or indexable versions of a page. In WordPress, this risk is mitigated by configuring canonical tags, noindex rules, or plugin-level visibility controls that prevent test variants from appearing in search results.
In addition, many testing tools integrate with WordPress SEO plugins to maintain consistent canonical and indexing behavior across all versions.
Beyond visibility issues, A/B testing can also influence technical SEO because test scripts add execution overhead. WordPress manages this by allowing scripts to be deferred, inlined, or conditionally loaded, preventing test logic from slowing initial rendering and preserving performance signals.
When these safeguards are in place, A/B testing can improve engagement-based metrics such as click-through rate, session duration, and bounce rate, which signal perceived relevance in search.
As a result, A/B testing complements a WordPress SEO strategy, provided that variant visibility is controlled and the control version remains the stable reference for indexing.


Contact
Don't like forms?
Shoot us an email at [email protected]