Bounce Rate

Table of Contents
Bounce rate is a website metric that measures the percentage of sessions in which a user visits a page and leaves without clicking, scrolling, or interacting further. In digital marketing, it helps explain whether a page meets user expectations when a user first arrives at the website.
Before bounce rate can be used, it must be clearly defined, because the result depends on how a single-interaction visit is counted. Once expressed as a percentage, the number only makes sense when compared against benchmarks and ranges, which indicate how the result should be interpreted based on the page type and user intent.
Bounce rate varies based on factors such as traffic source and intent, page load speed and technical issues, content relevance and clarity, and UX and navigation structure.
These same factors explain how to reduce bounce rate, including matching content to search intent, improving the page’s first impression, speeding up load times, and simplifying navigation.
What is Bounce Rate?
Bounce rate is a website analytics metric that measures the percentage (%) of sessions in which a user enters a landing page and leaves without triggering a qualifying interaction.
Within digital marketing and SEO analytics, this metric applies strictly to website session behavior. The exact bounce condition depends on how analytics tools record interaction or engagement proxies, which means definitions can vary slightly by platform.
Bounce rate is not the same as exit rate and is not a direct measure of content quality. Its meaning depends on the page’s purpose and user intent, so it cannot be judged inherently good or bad by just definition.
Bounce Rate Calculation
Bounce rate calculation describes how bounce rate is measured based on sessions that meet a specific bounce condition. Bounce rate is calculated by dividing bounced sessions by total sessions and expressing the result as a ratio.
A session counts as a bounce when it contains exactly one page view on the landing (entry) page and records no qualifying interaction or engagement. To perform the calculation, analytics data must identify the total number of sessions and label which of those sessions are bounce ones under that defined rule.
The same bounce rate formula applies to any defined analysis scope. The metric is measured as a per session ratio across the site as a whole, or grouped by page, traffic source, device, campaign, or time period without changing the calculation.
Once the value exists, it can be compared against benchmarks and ranges to interpret what the result represents within the website or property being measured.
Bounce Rate Benchmarks and Ranges
What Is a Good Bounce Rate?
A good bounce rate is a context-based judgment within benchmarks and ranges. A rate is considered good when it aligns with the page type (informational vs. transactional), the user intent behind the visit, and the traffic source that delivered the session.
Informational pages often fall within higher acceptable ranges because users may complete their goal in a single view, whereas transactional or lead-driven pages usually require lower ranges to signal continued interaction toward the website goal, which is tied to overall site performance.
Brand traffic and returning users typically indicate lower bounce behavior than non-brand or paid discovery traffic, which sets different comparison expectations.
Evaluation only makes sense when a bounce rate is compared against similar pages using consistent tracking and reporting rules under the same context source, because mismatched definitions distort whether performance reflects alignment or a content-expectation mismatch.
What Is a Bad Bounce Rate?
A bad bounce rate depends on how it compares to expected benchmarks and ranges for a page’s purpose and user intent, and suggests the page may not be working as intended.
A bounce rate is considered bad when it is higher than the expected range or benchmark for similar pages, or when it deviates from the same page’s past performance under consistent tracking rules and definition.
In this sense, bad signals a possible mismatch between user expectations and what the page provides, or friction that limits progress toward the page’s intended outcome. This judgment applies only when the bounce rate aligns with an unmet goal, not when the page is designed to satisfy intent in a single visit.
Such friction may indicate misaligned intent, unclear relevance or value, speed or technical issues, or UX and navigation problems. However, the label itself only points to a performance risk and signals the need for further evaluation
Factors that Influence Bounce Rate
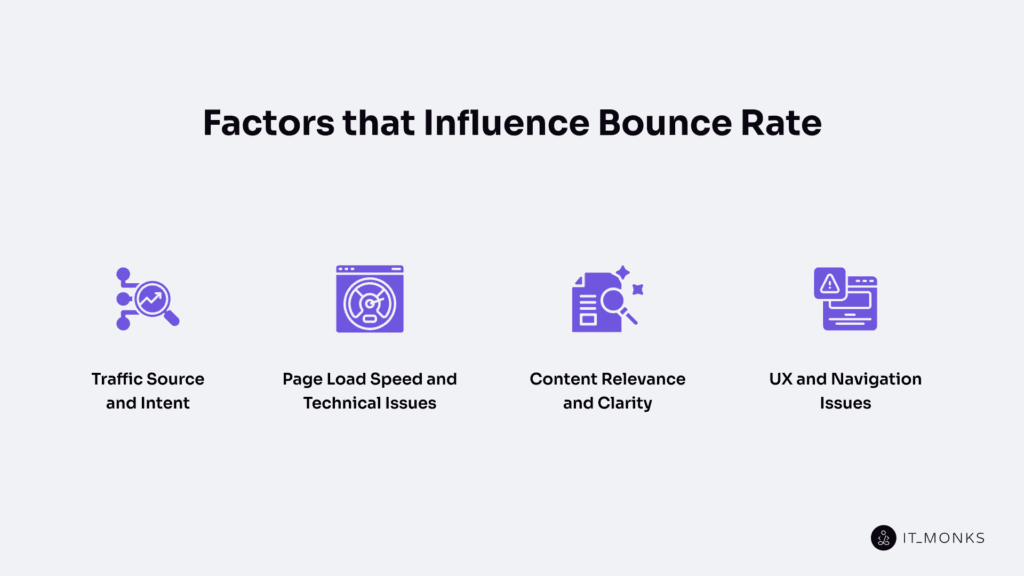
Traffic Source and Intent
Bounce rate varies by traffic source because each source creates different expectations before a visitor reaches the landing page. These expectations shape user intent, or what the visitor wants to do on the page.
When the page matches the intent implied by the message the user clicked (such as a search result, ad, or email), the bounce rate usually remains within the normal range for that context. When the page does not match user expectations, the bounce rate increases because users leave without taking the expected action.
For example, organic search often brings visitors looking for information; paid traffic brings visitors responding to ads; social traffic often brings casual browsers; while referral, email, and direct traffic more often bring visitors with a specific goal.
Because of this, bounce rate should be analyzed by source and intent, comparing the same page type in the same context. Without this approach, a bounce caused by expectation fit can be misclassified as a page issue, depending on how the site’s bounce rate is measured.
Page Load Speed and Technical Issues
Page load speed and technical issues directly influence bounce rate by determining whether a page is usable before a visitor leaves.
When a page loads slowly, users often exit before they can read, click, or interact, which increases bounce rate even when user intent and content are well aligned.
Technical issues such as errors, broken elements or links, layout instability, mobile rendering problems, or interfering tracking scripts can block access or interrupt interaction, causing exits when the page fails to load, render, or function as expected. When this occurs before any interaction is possible, the bounce rate can increase even if the content matches users’ search intent.
If the bounce rate increases across multiple pages or traffic sources simultaneously, page speed and technical stability are more likely causes than content issues.
Content Relevance and Clarity
Bounce rate is strongly influenced by content relevance and clarity because visitors come with a specific intent shaped by the source message, such as a search query, snippet, ad, or link. As soon as they reach the page, they judge whether it matches their expectations.
When the main content does not align with the headline or fails to deliver the expected value, the bounce rate increases as users leave to look for a better match. This judgment always occurs within a specific traffic and intent context.
Even when the topic is relevant, clarity is key to whether visitors stay. If users cannot quickly understand what the page offers or what to do next, confusion can occur. Unclear wording, hidden answers, or misleading headlines can raise bounce rate even when the subject itself is appropriate.
Because relevance and clarity fall between intent and action, they should be evaluated within the same segment and traffic source before assuming UX or navigation issues are the primary cause.
UX and Navigation Issues
Bounce Rate is influenced by UX and navigation because they shape how easily users can move from landing on the page to action.
When UX creates friction, such as a confusing layout, weak information hierarchy, poor readability or scanability, intrusive popups, or a disruptive mobile experience, users may leave without interacting, even when the content matches their intent. These issues disrupt understanding, obscure important information, obscure the next step, and make the page feel harder to use than users expect, given the context that brought them there.
Navigation affects bounce rate by determining whether a clear path to the next page or action is visible. Unclear menus, weak internal links, or pages that fail to guide users to the next step can make visitors feel lost and prevent deeper navigation within the site.
When content relevance is confirmed, but users still exit quickly, UX and navigation friction are likely contributors. Because these layers connect content relevance to user behavior, they should be evaluated within the same intent and traffic source segments to avoid confusing UX issues with intent mismatch.
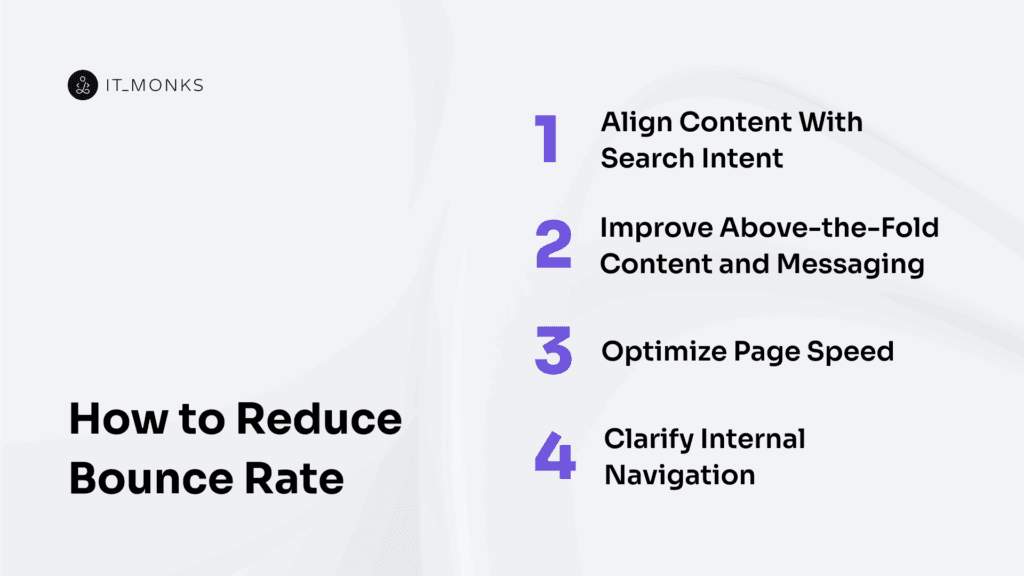
How to Reduce Bounce Rate
Reducing bounce rate means ensuring the page matches visitors’ expectations and removing friction that prevents engagement, rather than forcing clicks or trying to keep every visitor on the site.
Bounce rate decreases when the page satisfies user intent and allows users to continue naturally; in some cases, a quick exit is appropriate because the page has done its job.
Bounce rate improvement follows a simple order: aligning content with search intent reduces mismatches; clearly above-the-fold content and messaging help visitors confirm relevance immediately; page speed, with supporting technical factors often addressed during WordPress development, removes friction; and clear internal navigation provides a visible next step that prevents dead ends.
Changes should be evaluated within comparable segments, such as the same traffic source, intent type, and page role, and measured consistently using the same bounce rate definition, so results reflect real improvements rather than differences in traffic or page structure.
Align Content With Search Intent
Aligning content with search intent reduces bounce rate by ensuring the landing page delivers what visitors expect when they click a search result or ad. A query expresses intent, which sets expectations, and those expectations are tested by whether the page feels relevant.
When the page reflects the same promise implied by the snippet or ad message, visitors are more likely to stay; when that expectation is not met, a mismatch occurs, and bounce rate increases as users leave to find a better answer. Because intent defines the reason for the click, no improvements in speed, design, or navigation can fully offset a page that fails to satisfy it.
At a basic level, intent can be informational or commercial/transactional, and alignment means matching the page’s purpose to the query’s goal, not repeating keywords.
This match should be evaluated at the landing page level and per topic or query cluster, especially within a defined segment such as organic search traffic, using a consistent bounce-rate definition.
Improve Above-the-Fold Content and Messaging
Bounce rate improves when above-the-fold content and messaging clearly show visitors that they are on the right page. Above the fold is the portion of the page visible without scrolling, and it shapes the first impression by confirming what the page is about.
Visitors arrive with expectations set by the promise in a query, snippet, ad, or email, and bounce rate increases when the headline and message fail to match that promise or hide the value. A clear headline signals topic match, a concise value statement communicates relevance, and visible trust or credibility cues support confidence when needed.
When above-the-fold messaging aligns with expectations and communicates clarity immediately, visitors are more likely to stay; when the message is vague or mismatched, confusion leads to early exits before engagement can begin.
Optimize Page Speed
Optimizing page speed reduces bounce rate by removing delays and instability that cause visitors to leave before the page is usable.
When page speed is slow, long load times, heavy media, or blocking scripts/tags delay content loading or cause visible layout shifts, the page feels unstable and hard to use, especially on mobile, which increases early exits across traffic sources.
Faster, more stable page performance allows the first meaningful content to appear quickly and remain in place, so the above-the-fold message can be seen and understood without interruption.
Improving stability by avoiding visible layout shifts reduces friction and helps maintain trust during the first seconds of a visit.
Once speed and stability issues are addressed, changes to navigation and next steps can be evaluated without performance noise influencing bounce behavior.
Clarify Internal Navigation
Clarifying internal navigation reduces bounce rate by giving visitors a clear next step after the landing page answers their initial question, even when content relevance and page performance are already adequate.
When internal navigation is unclear, for example, menus are hard to scan, internal links are missing or poorly labeled, or the page structure creates a dead end, users stop because there is no obvious path to continue, even if the content matches user intent.
A clear menu hierarchy, relevant internal links to related content, and consistent labels/link text that match the user’s language improve discoverability and guide visitors forward.
Informational visitors need visible paths to deeper resources, while transactional visitors need a direct route to action.
Bounce Rate vs Other Engagement Metrics
Bounce Rate vs Exit Rate
Bounce rate and exit rate are two metrics that both relate to leaving, but they measure different points in a session and indicate different behaviors.
Bounce rate measures the share of sessions that end immediately after a landing page loads, with no meaningful interaction or engagement, so it is tied to session start behavior and applies to entry pages.
Exit rate measures the share of pageviews in which a specific page was the last page in the session, regardless of how many pages were viewed before it, so it is tied to session-end behavior and applies to any page in the flow.
The difference is positional and unit-based: bounce rate is calculated from sessions that stop at the start, while exit rate is calculated from pageviews that end a session. As a result, a page can have a high exit rate without a high bounce rate if it appears late in the user flow.
A landing page can have a high bounce rate without a high exit rate if users leave immediately after entry. In all cases, interpretation must consider the page’s role in the flow.
This distinction sets the foundation for separating bounce rate from other engagement metrics, such as engagement rate and time on page, which evaluate different aspects of user behavior.
Bounce Rate vs Engagement Rate
Bounce rate and engagement rate compare 2 session-level classifications that reflect different session outcomes. Bounce rate identifies sessions that end before any meaningful interaction occurs, while engagement rate measures the share of sessions that are classified as engaged under defined interaction criteria.
In many analytics setups, engagement rate is calculated as the opposite of bounce rate, but this only works when both metrics use the same interaction rules and thresholds. If those rules differ, the two metrics will not match exactly.
Bounce rate helps surface early session termination, while engagement rate shows whether sessions that continue actually involve meaningful interaction aligned with session quality goals.
Bounce Rate vs Time on Page
Bounce rate measures the share of sessions that meet the bounce condition. Time on page describes the duration a visitor remains on a page, but duration alone does not confirm interaction, intent satisfaction, or goal success.
Bounce rate and time on page differ because time does not equal engagement: a session can have a long time on page without any meaningful interaction, or a very short time on page when the visitor quickly finds the answer and leaves.
Time on page can be misleading in a single-page session, where duration tracking may be incomplete or ambiguous. Time on page should be used only as a supporting signal and always interpreted in the context of page purpose, interaction expectations, and consistent measurement rules.
Tools That Track Bounce Rate
Bounce rate is produced by tools that track sessions and determine whether a session qualifies as a bounce based on detected interactions and engagement signals. Analytics tools are the primary source of the bounce rate number because they define, count, and report bounces at the session level.
Google Analytics 4 measures bounce rate as the share of sessions that were not engaged, whereas Adobe Analytics reports bounce rate as the share of single-hit visits relative to entries. Matomo, Piwik PRO, and Plausible also report bounce rate directly using their own interaction rules, which is why the same landing page can show different values across tools.
Behavior and heatmap tools help explain why users bounce rather than serving as the primary source of measurement. Hotjar may surface bounce rate in some dashboards and is commonly used to analyze behavior patterns, while Microsoft Clarity provides heatmaps and recordings but does not measure bounce rate itself.
Because bounce rate depends on the definition and tracking rules, comparisons and segmentation should rely on a single consistent analytics source and a stable measurement setup.
Crazy Egg functions as a hybrid tool, reporting its own bounce rate using internal rules while also supporting behavioral diagnosis.


Contact
Don't like forms?
Shoot us an email at [email protected]