Customer Experience Optimization

Table of Contents
Customer experience optimization is a measurable improvement process often used in WordPress website development, focused on how users move through a site, how interactions support a target action, and how performance is verified through tracking and metrics.
Experience optimization requires a clear scope before evaluating its impact. In a WordPress website, this scope includes the target action, the user path that leads to it, and the metric that measures completion. When this scope is clear, drop-off can be identified and conversion performance evaluated.
The user experience optimization strategy begins with a target action that determines what the WordPress website aims to increase. User path defines how users move toward that action.
Tracking measures path performance and identifies drop-off, where friction weakens intent. Data collection explains the cause, and optimization change improves the weak point.
The test validates the change, and the measurement compares the result to a baseline.
Continuous customer experience optimization repeats this sequence over time. As content, traffic, and behavior change inside a WordPress website, metrics and path performance also change. Customer experience optimization maintains the same structured loop, ensuring results remain measurable, validated, and aligned with continuous improvement rather than a one-time iteration.
What is Experience Optimization?
Experience optimization is a measurable process that improves customer and user experience on WordPress websites by reducing friction and increasing conversion rates through validated changes. It also supports enterprise digital experience optimization initiatives across complex WordPress environments.
Customer experience optimization focuses on interaction, navigation, clarity, speed, touchpoints, and funnel behavior inside the WordPress website. Success is measured by metrics that track performance as rates, times, counts, or percentages. These metrics are informed by user behaviour analytics, which capture real interaction data such as click patterns, scroll depth, session paths, and engagement signals.
Why Experience Optimization Matters?
Experience optimization matters because friction in the user path causes drop-off, and drop-off reduces completion of the target action. In a WordPress website, friction appears as slow performance, unclear navigation, confusing interaction, errors, poor responsiveness, or weak accessibility. These issues create hesitation, increase time on task, and lower user confidence.
Customer experience optimization reduces friction and improves clarity, speed, and consistency. As the user path becomes smoother, engagement increases, abandonment decreases, and conversion and completion rates improve. Better performance builds trust and supports retention. These outcome changes are reflected directly in performance metrics such as conversion rate, completion rate, error rate, and time-on-task, strengthening both customer experience and user experience (UX) optimization efforts and aligning practical implementation with the principles outlined in a conversion rate optimization guide.
User Experience Optimization Strategy
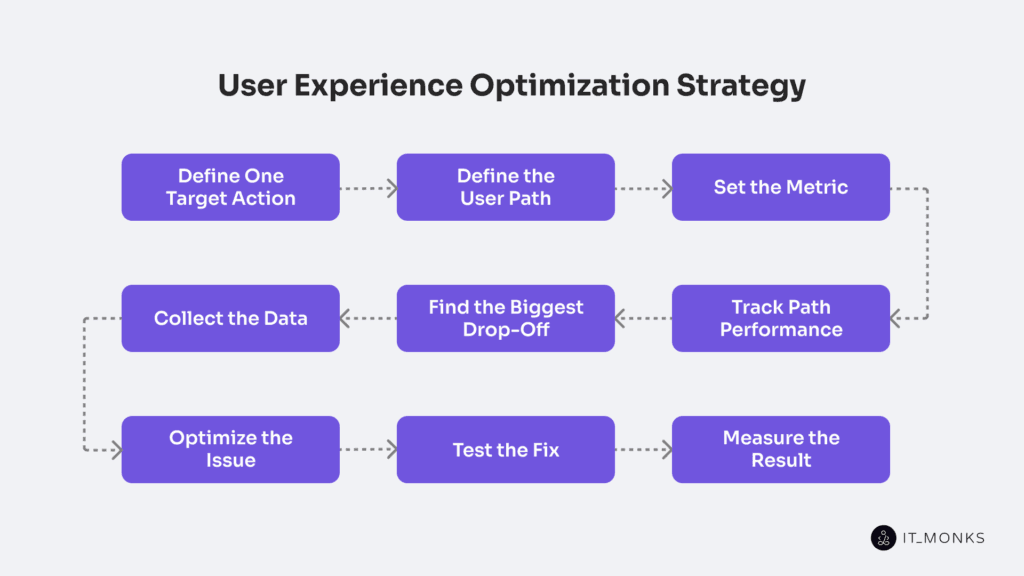
User experience optimization strategy follows a clear, step-by-step workflow that turns customer experience optimization into measurable action. The strategy consists of a single ordered sequence in which each step leads to the next and keeps results provable through metrics, tracking, testing, and measurement.
User experience optimization Strategy applies across business models because measurable paths, defined target actions, and attribution rules are required in both B2C and B2B environments. In B2B customer experience optimization, this structure supports long sales cycles, multi-step funnels, and consistent attribution across touchpoints.
The strategy starts with a target action, which defines the main goal users should complete. The user path then shows the funnel steps users take to reach that target action.
The metric makes the target action measurable and sets a baseline. Tracking path performance then tracks how users move through each funnel step. This tracking identifies where friction or a bottleneck appears. From this analysis, the biggest drop-off indicates the main loss point in the path and shows where optimization must focus.
The next step is collecting the data that is needed to explain why the drop-off occurs and to support a clear hypothesis. Optimizing the issue addresses the identified cause, and testing the fix validates whether the change impacts path performance. Finally, measuring the result confirms whether the metric improved and determines the final outcome.
Define One Target Action
A target action is a single user-completed event that signals a conversion. It defines the primary action that determines success in the WordPress website flow or page. The user experience optimization strategy measures and improves the target action.
A target action must reflect the user’s intent. Users arrive at a page with a defined purpose, for example, to purchase, request, download, subscribe, or contact, and the page must provide a clear mechanism that allows that intent to be completed and recorded as a measurable event.
The user performs this action to achieve a clear outcome, such as a completed account registration, a successfully downloaded resource, or a finalized newsletter subscription. The action is considered complete only when the user fully finishes the defined action, and the website records it as a real event. The event occurs at a specific step in the WordPress website flow, such as a page, and must have a defined result: completed or not completed.
The action must trigger a traceable analytics event, meaning the website records the moment the user completes the step and sends the record to analytics. This event allows a metric to measure how often the action completes and enables tracking to see where drop-off happens in the funnel. If the action cannot be measured, it cannot support customer experience optimization.
Choosing a single target action keeps the focus on a single main goal. Once the target action is defined, the user path shows the steps users take to reach it, and the metric measures how many users actually complete that final step.
Define the User Path
User path leads to the target action within the user experience optimization strategy. It is the ordered sequence of steps that connects an entry point to the completion of the target action within the WordPress website flow.
The path starts at a defined entry page and ends when the target action is completed. It includes only the steps that advance the intent: navigation steps, touchpoints, and decision points that support the conversion path. User path excludes browsing that does not support the conversion path.
The path contains a start node, intermediate steps, and an end node. Branches or variants may exist based on device or session, but the strategy requires one primary user path to measure first. This primary path supports consistent tracking across sessions and devices.
Path performance depends on the defined user path. It is measured by step progression, transition completion, conversion rates, time between steps, and error counts. Drop-Off occurs at a specific step or transition. Tracking observes these steps to identify friction or bottlenecks.
User path must be defined after the target action. A metric cannot measure progress without a mapped path, and tracking cannot detect drop-off without defined steps.
Set the Metric
The metric measures how successfully the target action is completed along the defined User Path. It represents a clear, measurable signal of success in WordPress website development. Metric aligns with user intent, has a clear unit (rate, percentage, seconds, or count), is tracked consistently, shows change through variance, and indicates improvement or decline without confusion.
The primary metric measures completion of the target action, typically as a conversion or completion rate, and serves as the main KPI. Supporting metrics quantify step conversion rate, drop-off rate, time on task, and error rate. It also describes path performance, but they do not replace the primary goal.
Metric establishes a baseline over a defined time window. Tracking observes metric values over time and compares them against the baseline and threshold to validate uplift. Drop-off becomes visible when variance exceeds the defined threshold on the user path.
Once the metric is defined and baselined, tracking can observe path performance, identify drop-off, and support result measurement within a consistent customer experience optimization loop.
Track Path Performance
Track path performance turns the defined user path into measurable path performance by capturing consistent signals tied to the target action and chosen metric, as outlined in a web analytics guide for structured measurement and implemented through a customer experience optimization platform.
In practice, this measurement layer should be supported by the best digital experience optimization tools that consistently capture event data, path transitions, and performance signals, enabling reliable comparisons across baselines, tests, and WordPress releases.
Path performance tracking records consistent signals for every step and transition. Each step measures completion, exit or abandonment, error frequency, time per step (in seconds), step progress, and counts. Each transition measures how many users move to the next step versus how many leave.
All measurements remain aligned with the chosen metric and the same path definition. Path performance aggregates step data into a single sequence expressed as percentages, counts, and seconds.
Consistent step names, transition logic, units, and coverage create a stable baseline. Monitoring compares the current metric level to the baseline to detect variance and trend.
Path performance shows a drop-off at the step or transition with the weakest completion, the highest exit or abandonment, the highest error, or the longest abnormal time on step. Once identified, data collection focuses on that exact point for diagnosis and improvement.
Find the Biggest Drop-Off
The biggest drop-off identifies the step or transition in the user path where the largest loss of users occurs based on the defined metric and tracked path performance. It shows up as the sharpest decline in step conversion rate, the highest exit rate, or the strongest abandonment between 2 funnel steps. Because the target action depends on every earlier step, the biggest drop-off becomes the main bottleneck and the highest-impact friction point.
Path performance reveals this by comparing each step’s progress rate. The process is straightforward: compare step conversion rates, locate the largest step loss, measure exit rate, error rate, and time on step, and rank steps by loss size. The biggest drop-off is selected based on maximum loss under stable traffic conditions.
Tracking must confirm that the drop-off is meaningful. Validation includes confirming an adequate sample size, consistent traffic over time, and a stable baseline trend to avoid statistical noise or a one-time anomaly. Segmentation by device, traffic source, or page template helps identify which segment shows higher abandonment and supports clear prioritization.
Funnel analysis and path exploration reports in web analytics tools, such as GA4-style funnels or similar systems, help compare step-by-step conversion and exits. Heatmaps and session recordings, for example hotjar or Microsoft Clarity, provide behavioral signals. Form analytics, error monitoring, and server logs in WordPress website development help detect technical issues that align with the drop-off.
The biggest drop-off marks the point of diagnosis between measurement and action. Once the high-impact step is identified, validated, and isolated, the strategy moves to data collection to explain the cause before defining an optimization fix.
Collect the Data
Data collection begins after the biggest drop-off is confirmed on the defined user path. The drop-off step defines the scope of data collection. The declining metrics define which signals must be captured and compared to the baseline.
In WordPress website development, tracking and path performance reports capture quantitative metrics such as rates, counts, latency, and error events. These signals are segmented and compared by device, traffic source, page template, and new versus returning cohort to isolate patterns linked to the same drop-off.
Qualitative evidence is collected for the same step. Heatmaps, session recordings, form analytics, feedback, support messages, performance metrics, and logs provide clues about behavior. Event tracking signals and error events help attribute friction to validation errors, slow loading, layout shifts, or plugin bottlenecks. Data collection must align with privacy and consent requirements.
Signal quality is validated before interpretation. Coverage, consistency, sample size, and comparable time windows are checked to prevent distorted evidence. Segmentation confirms where the drop-off concentrates.
The collected evidence is then summarized to define the most likely friction cause. That documented cause becomes the input for the next step, where it can be isolated, tested, and validated against the same metric.
Optimize the Issue
Optimizing the issue helps to turn the largest drop-off into a targeted fix for a specific user-path step or transition in WordPress website development. Using the collected evidence, the analysis identifies the most likely friction cause, such as clarity gaps, performance latency, form friction, validation errors, content mismatch, or missing trust signals.
The goal is defined in metric terms: reduce drop-off, improve completion or conversion rate, lower error rate, or shorten time on step. One optimization fix is implemented at that step to clarify, simplify, improve performance, validate, adjust forms, align content, or add reassurance.
In WordPress website development, the change applies to a template section, page component, or controlled plugin behavior, while the focus remains on the step.
The scope remains limited to one primary change that isolates the friction-causing factor. The optimization fix must then be validated so the same metric confirms reduced drop-off and improved completion of the target action.
Test the Fix
Testing the fix validates the optimization fix by converting the change into a controlled comparison. It targets the same biggest drop-off on the defined user path and compares a baseline to a variant using a single target action and the same metric, typically executed and monitored using customer experience optimization software to ensure consistent assignment, tracking, and attribution.
The test can use A/B testing, split testing, or a controlled rollout, but the control and variant must share identical paths, event definitions, and tracking to maintain clean attribution.
Test the fix’s success criteria before launch, and control noise by adjusting sample size, duration, and segmentation by traffic mix, device cohort, and timing to detect seasonality or regressions.
During WordPress website development, testing the fix verifies tracking accuracy, controls caching and performance behavior, monitors for regressions, and rolls back the fix if harm appears. In the test, the fix becomes the measured input for the result.
Measure the Result
Measuring the result validates whether the tested fix improved the defined metric for the same target action along the same user path. Measurement restates the metric, compares the baseline (before the change) with the variant (after the change).
The metric is measured in its original units, such as percentages, counts, or seconds. The delta quantifies the metric change, showing direction (up or down) and the size of the change.
Measuring the result reconnects the outcome to the biggest drop-off. Step conversion, drop-off reduction, time on step, and error rate at the affected step must be compared. Then overall target action completion must be confirmed. A step improvement without overall growth in completion signals a trade-off.
Segmentation validates consistency; results are segmented by device, traffic source, and page template in the context of WordPress website development. A true uplift confirms consistency across key segments and avoids cherry-picking.
Regression check monitors the user path for side effects. New drop-offs, increased error rate, or performance regressions must be detected.
The decision depends on the measured delta and consistency. The change is kept if uplift is stable, iterated if partial, and rolled back if the metric regresses. Each decision feeds into continuous customer experience optimization.
Continuous Customer Experience Optimization
Continuous customer experience optimization functions as the ongoing operating mode of the optimization process. Optimization runs in a repeatable cycle as users, content, and traffic evolve in WordPress development environments.
Interface stability does not guarantee stable outcomes. WordPress site changes, such as theme or template updates, plugin additions, content publishing, performance shifts, or changes in traffic mix, can introduce metric drift, regressions, or new friction without an explicit redesign, making continuous monitoring necessary.
To preserve comparability over time, continuous customer experience optimization maintains its foundations. The target action remains fixed, the user path definition stays consistent, and the metric and tracking do not change. This allows baselines, trends, and regressions to be measured with integrity. Automated customer experience optimization monitors deviations without altering the underlying measurement model.
Changes happen when the WordPress website development environment evolves. New releases, design adjustments, content updates, traffic shifts, or performance changes can alter user behavior, segment distribution, conversion rates in percentage points, performance in seconds, and error rates. Even without a full redesign, these shifts can introduce new drop-offs or regression signals.
Operationally, continuous customer experience optimization runs in a loop: monitor metrics and path performance against the baseline, detect new drop-offs or regression signals, collect data to form a testable hypothesis, ship a focused fix, test the change, and measure results. Each cycle updates the baseline and documents outcomes to prevent regressions.
In this model, the user experience optimization strategy becomes a reusable system that supports long-term optimization and scales with ongoing WordPress website development.
Define, measure, detect, test, and validate, repeating on a planned cadence and supported by monitoring alerts, to control metric drift and keep experience quality stable as WordPress website development introduces ongoing change.


Contact
Don't like forms?
Shoot us an email at [email protected]