Explore our specialized services, tailored solutions, and industry expertise to elevate your digital presence. From custom WordPress development to seamless integrations, we build high-performing websites that deliver impact.
We checked 79 websites of U.S. manufacturers the way a real buyer uses them: Can I open the site? Can I tell if the product fits my job? Can I trust this company? Can I get a price? Every figure on this page comes from that check, and every claim about the wider market links to its source.
0%
16 of 79 have a quote button that knows which product the buyer was looking at
0%
55 of 79 offer a datasheet to download; only 7 of 22 catalog part makers offer CAD files
0%
20 of 79 pass Google's Core Web Vitals speed test
0%
68 of 79 show at least one quality certificate their industry expects
Summary
Key takeaways
Four conclusions. Each one is backed by a chart further down.
01Check the product
The numbers are on the page. The files are not.
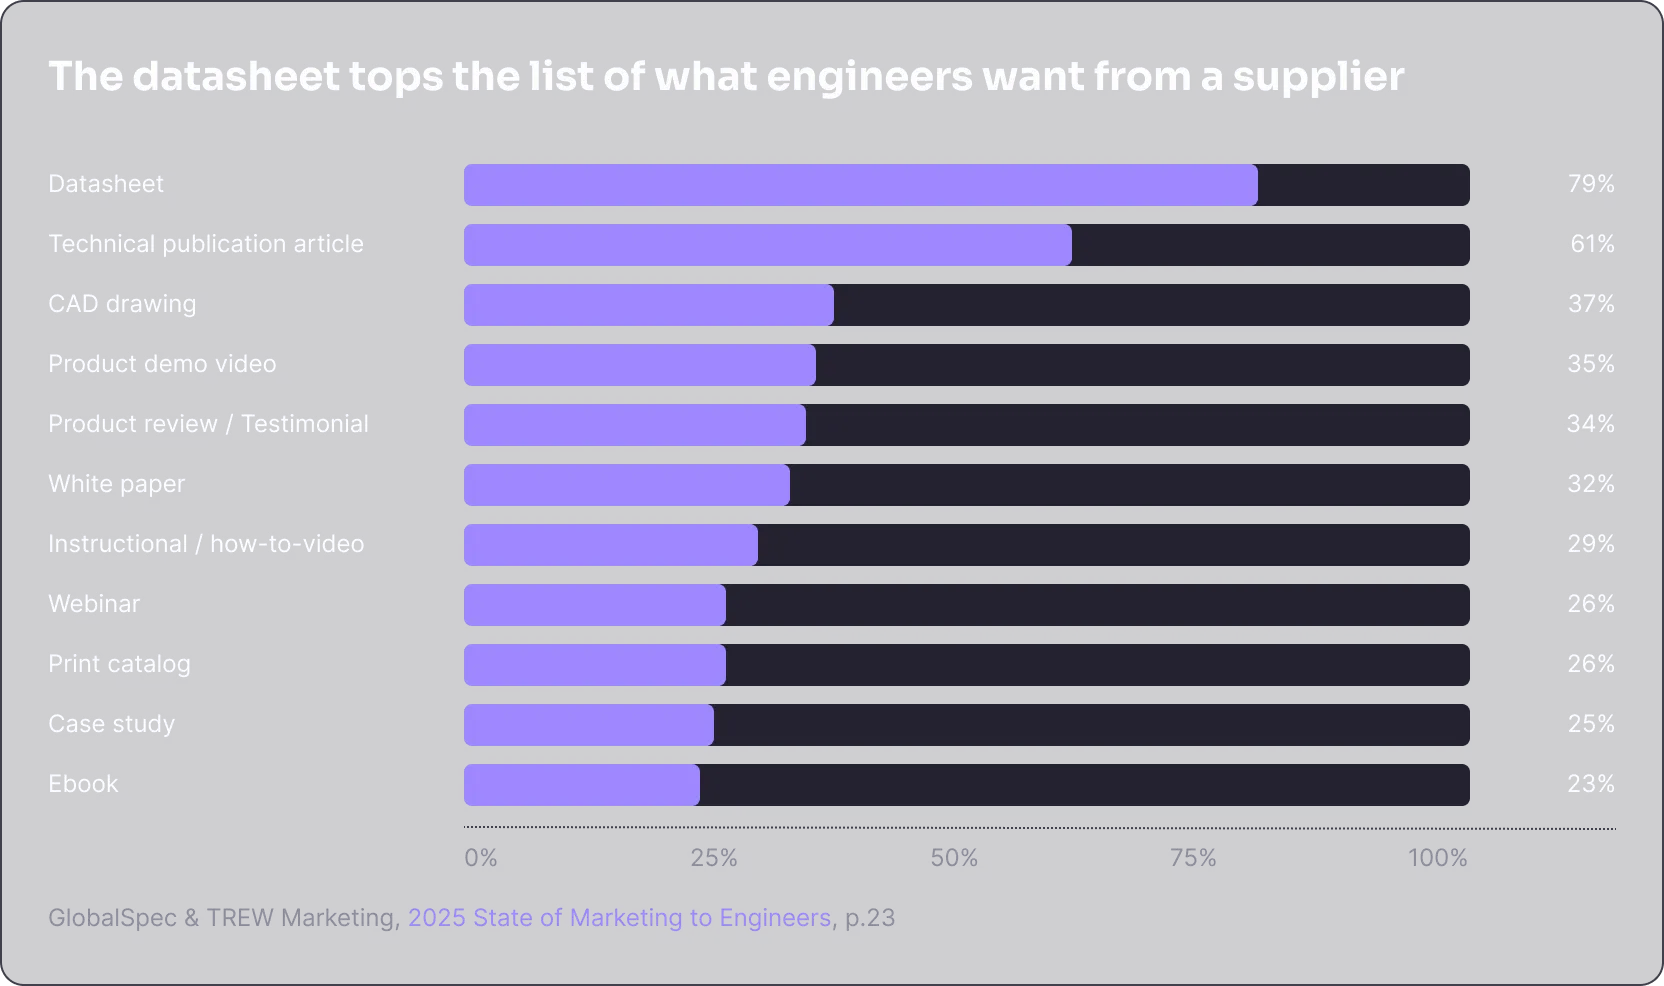
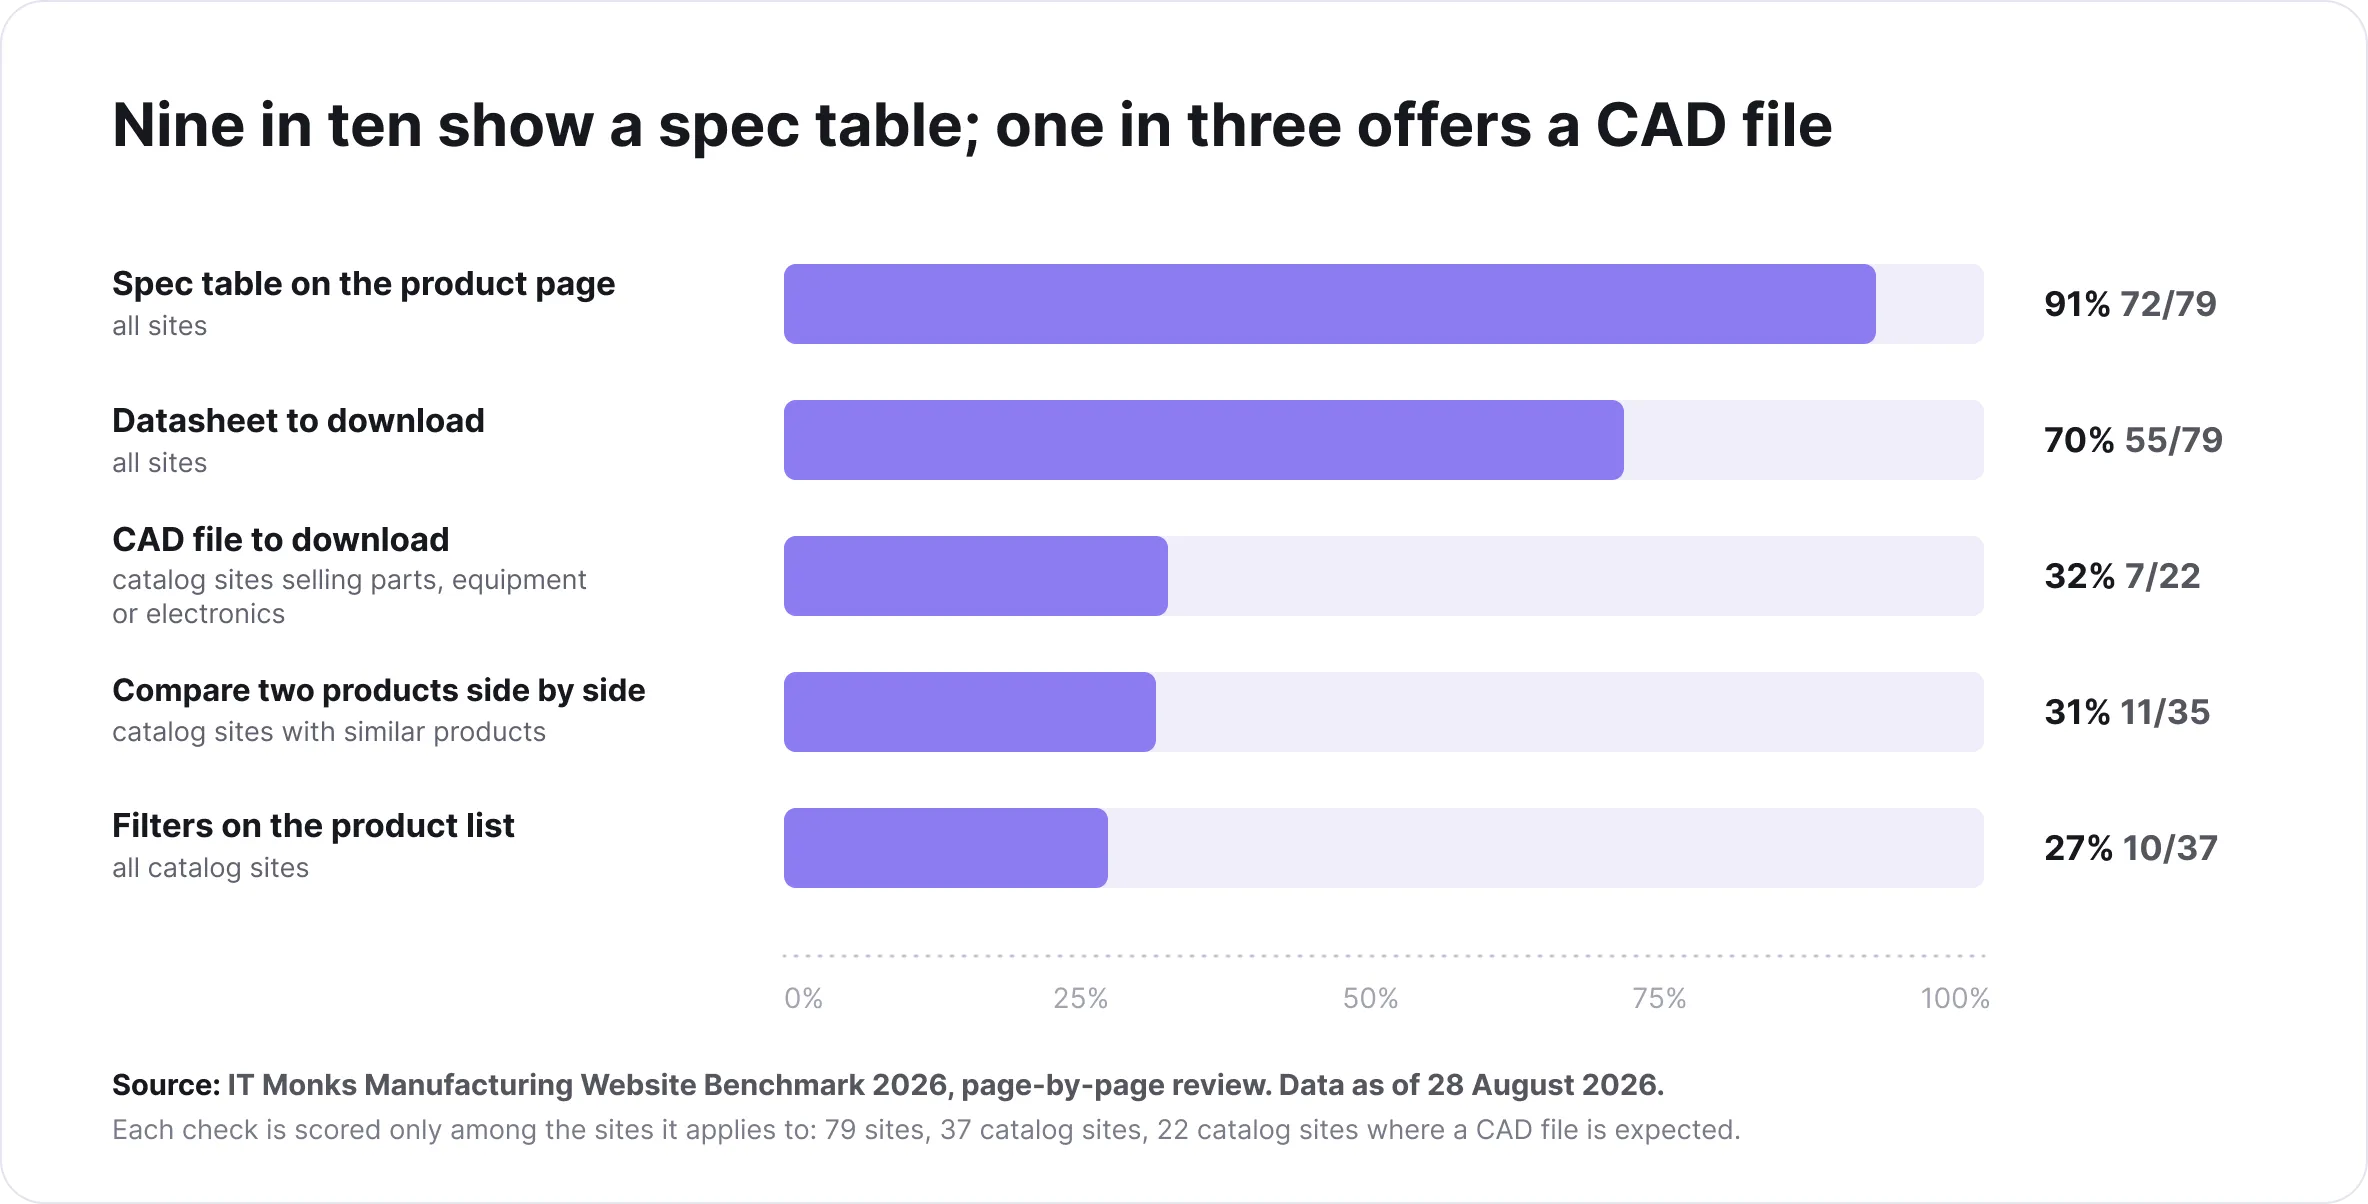
72 of 79 sites show a spec table. But only 55 of 79 offer a datasheet to download, 7 of 22 catalog part makers offer CAD files, and 11 of 35 catalog sites let a buyer compare two products. Engineers rate the datasheet as the most useful thing a supplier can publish (79%).
02Ask for a price
The quote button usually does not know the product.
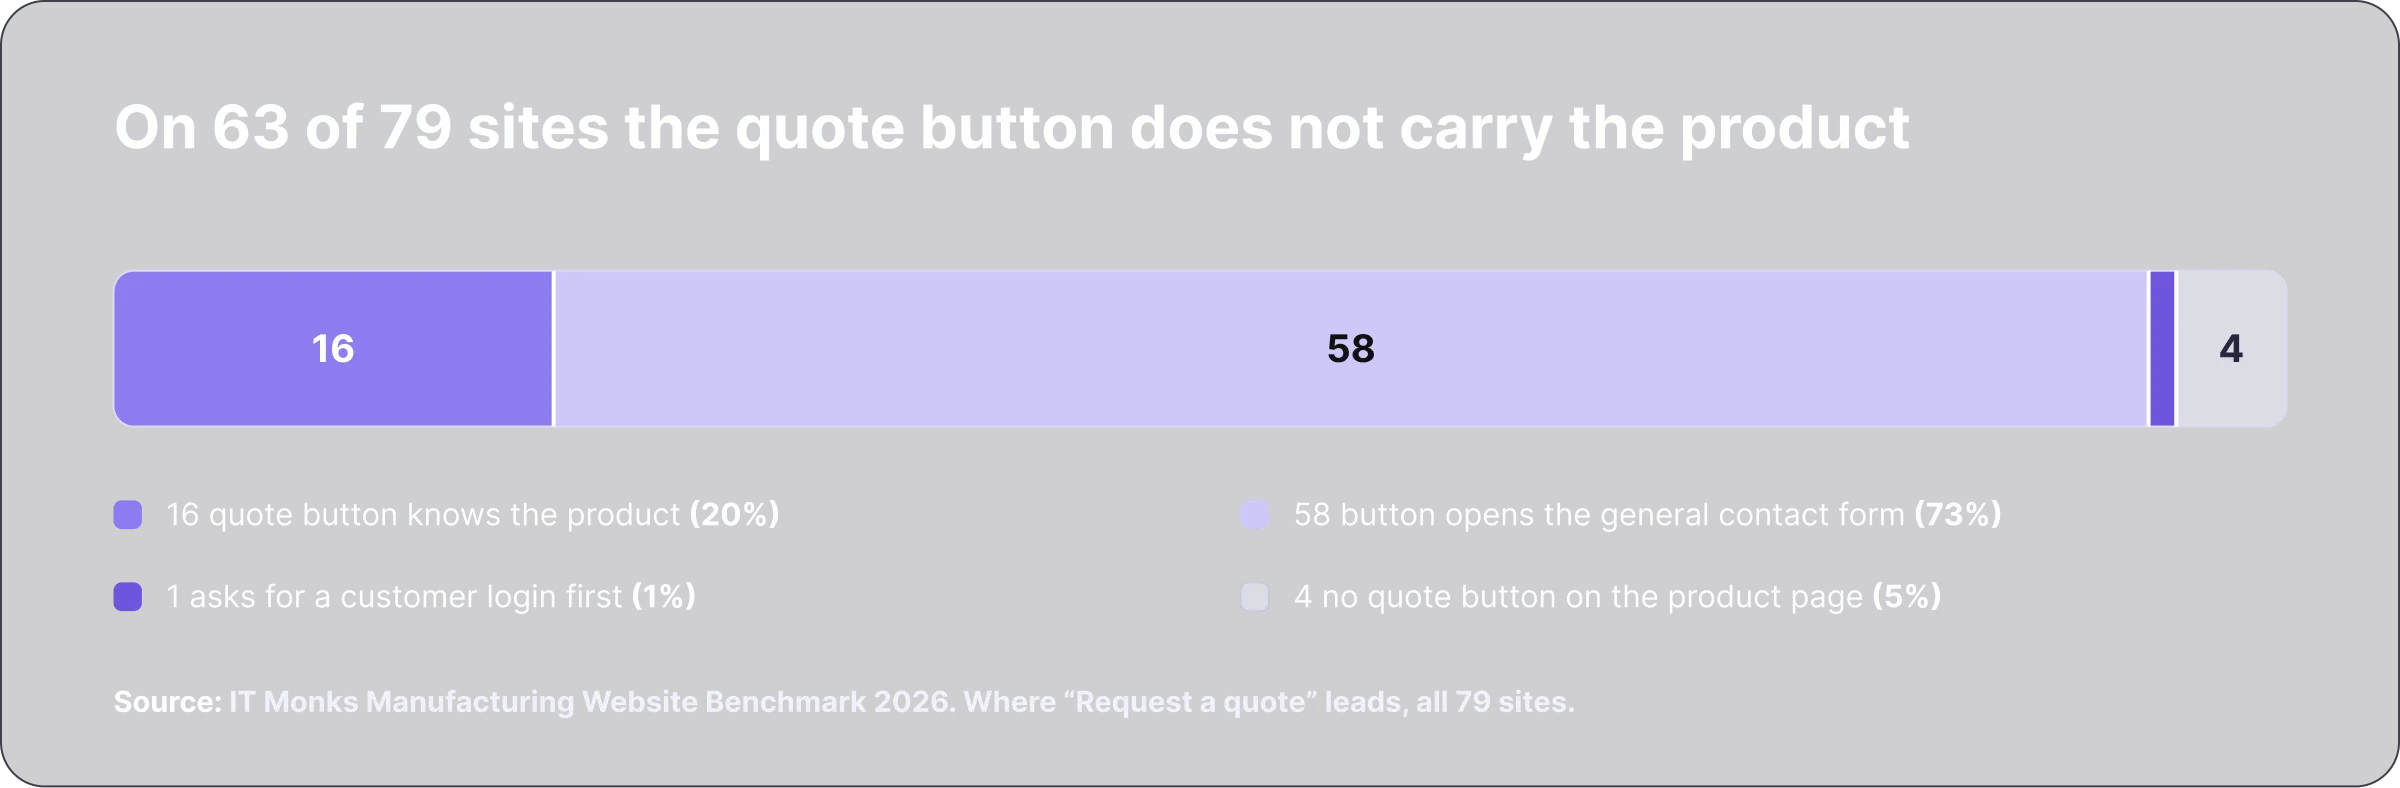
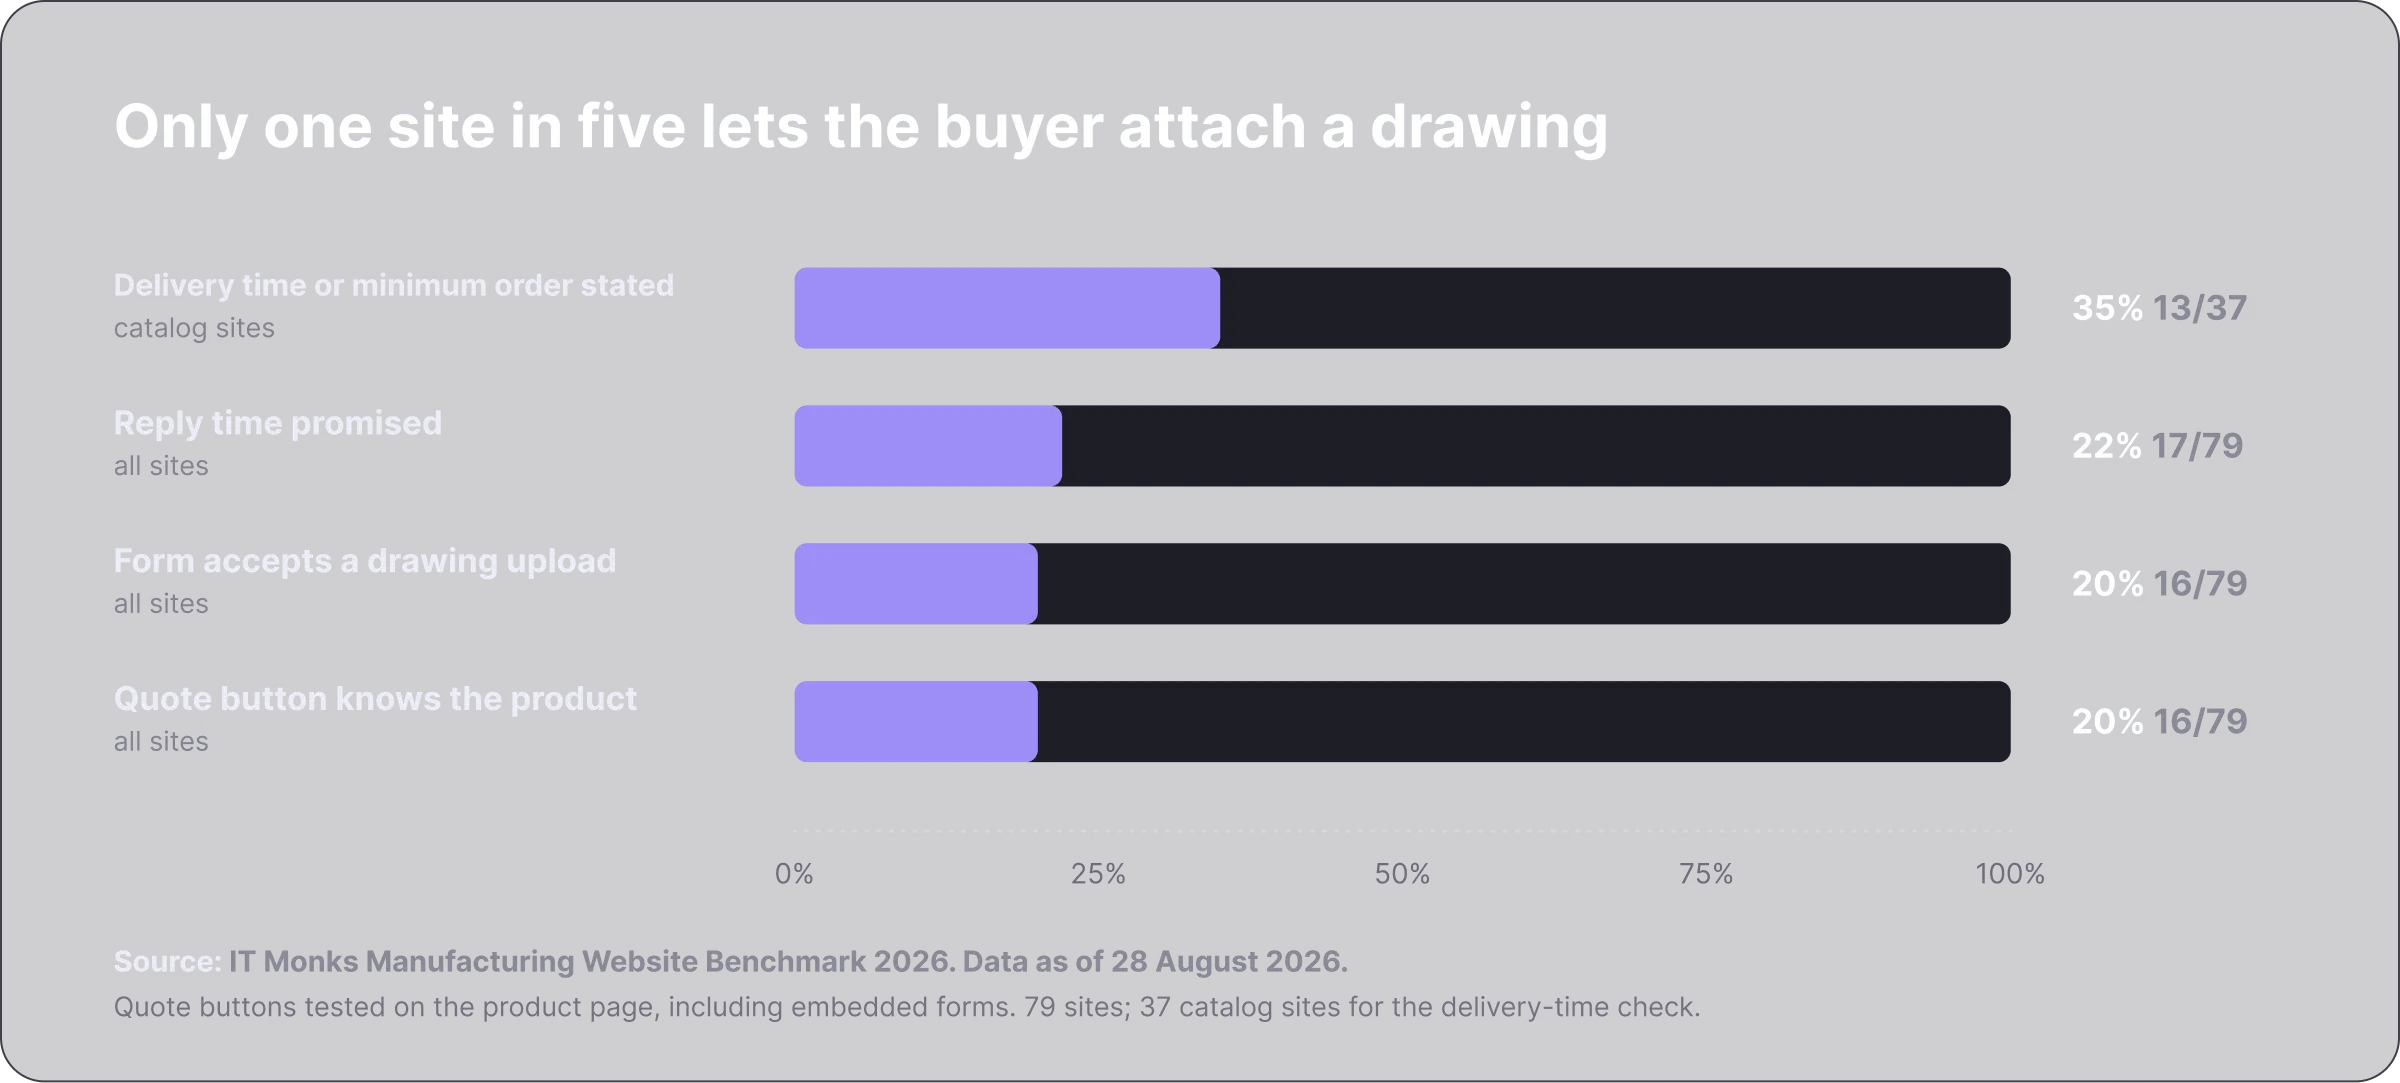
On 63 of 79 sites the “Request a quote” button does not carry the product: 58 open the general contact form, 1 asks for a login, 4 have no button. Only 16 of 79 let the buyer attach a drawing.
03Company size
Big companies do not have better websites.
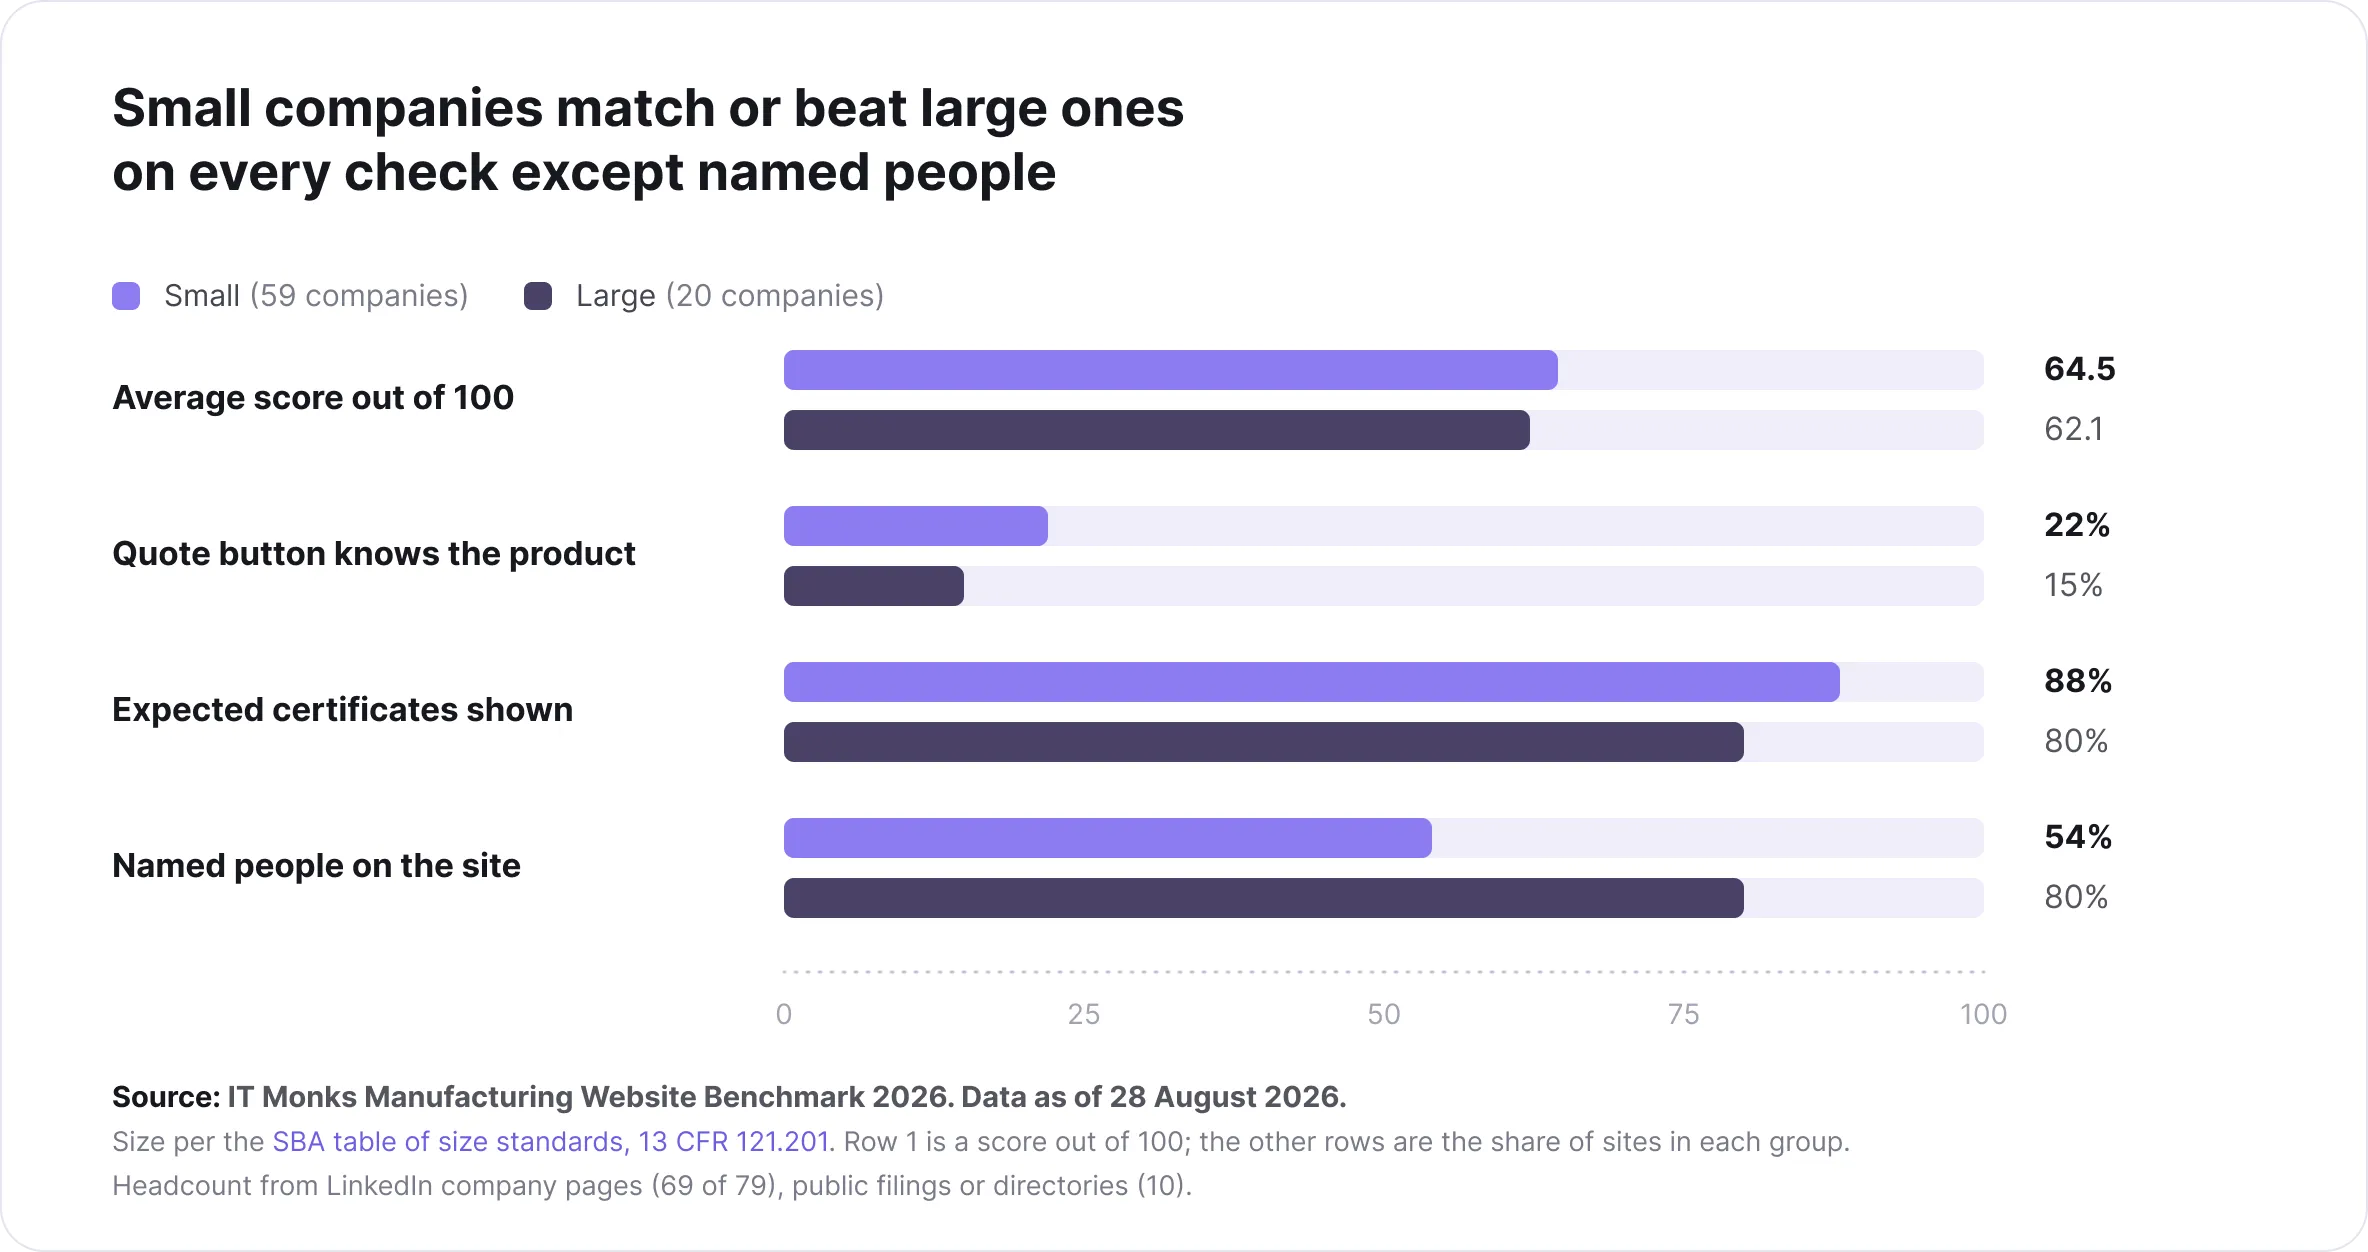
Small companies scored 64.5 out of 100 on average, large companies 62.1. Small companies more often had a product-aware quote button (22% vs 15%) and showed expected certificates (88% vs 80%). Large companies more often named their people (80% vs 54%).
04The best sites
Even the best sites have a gap.
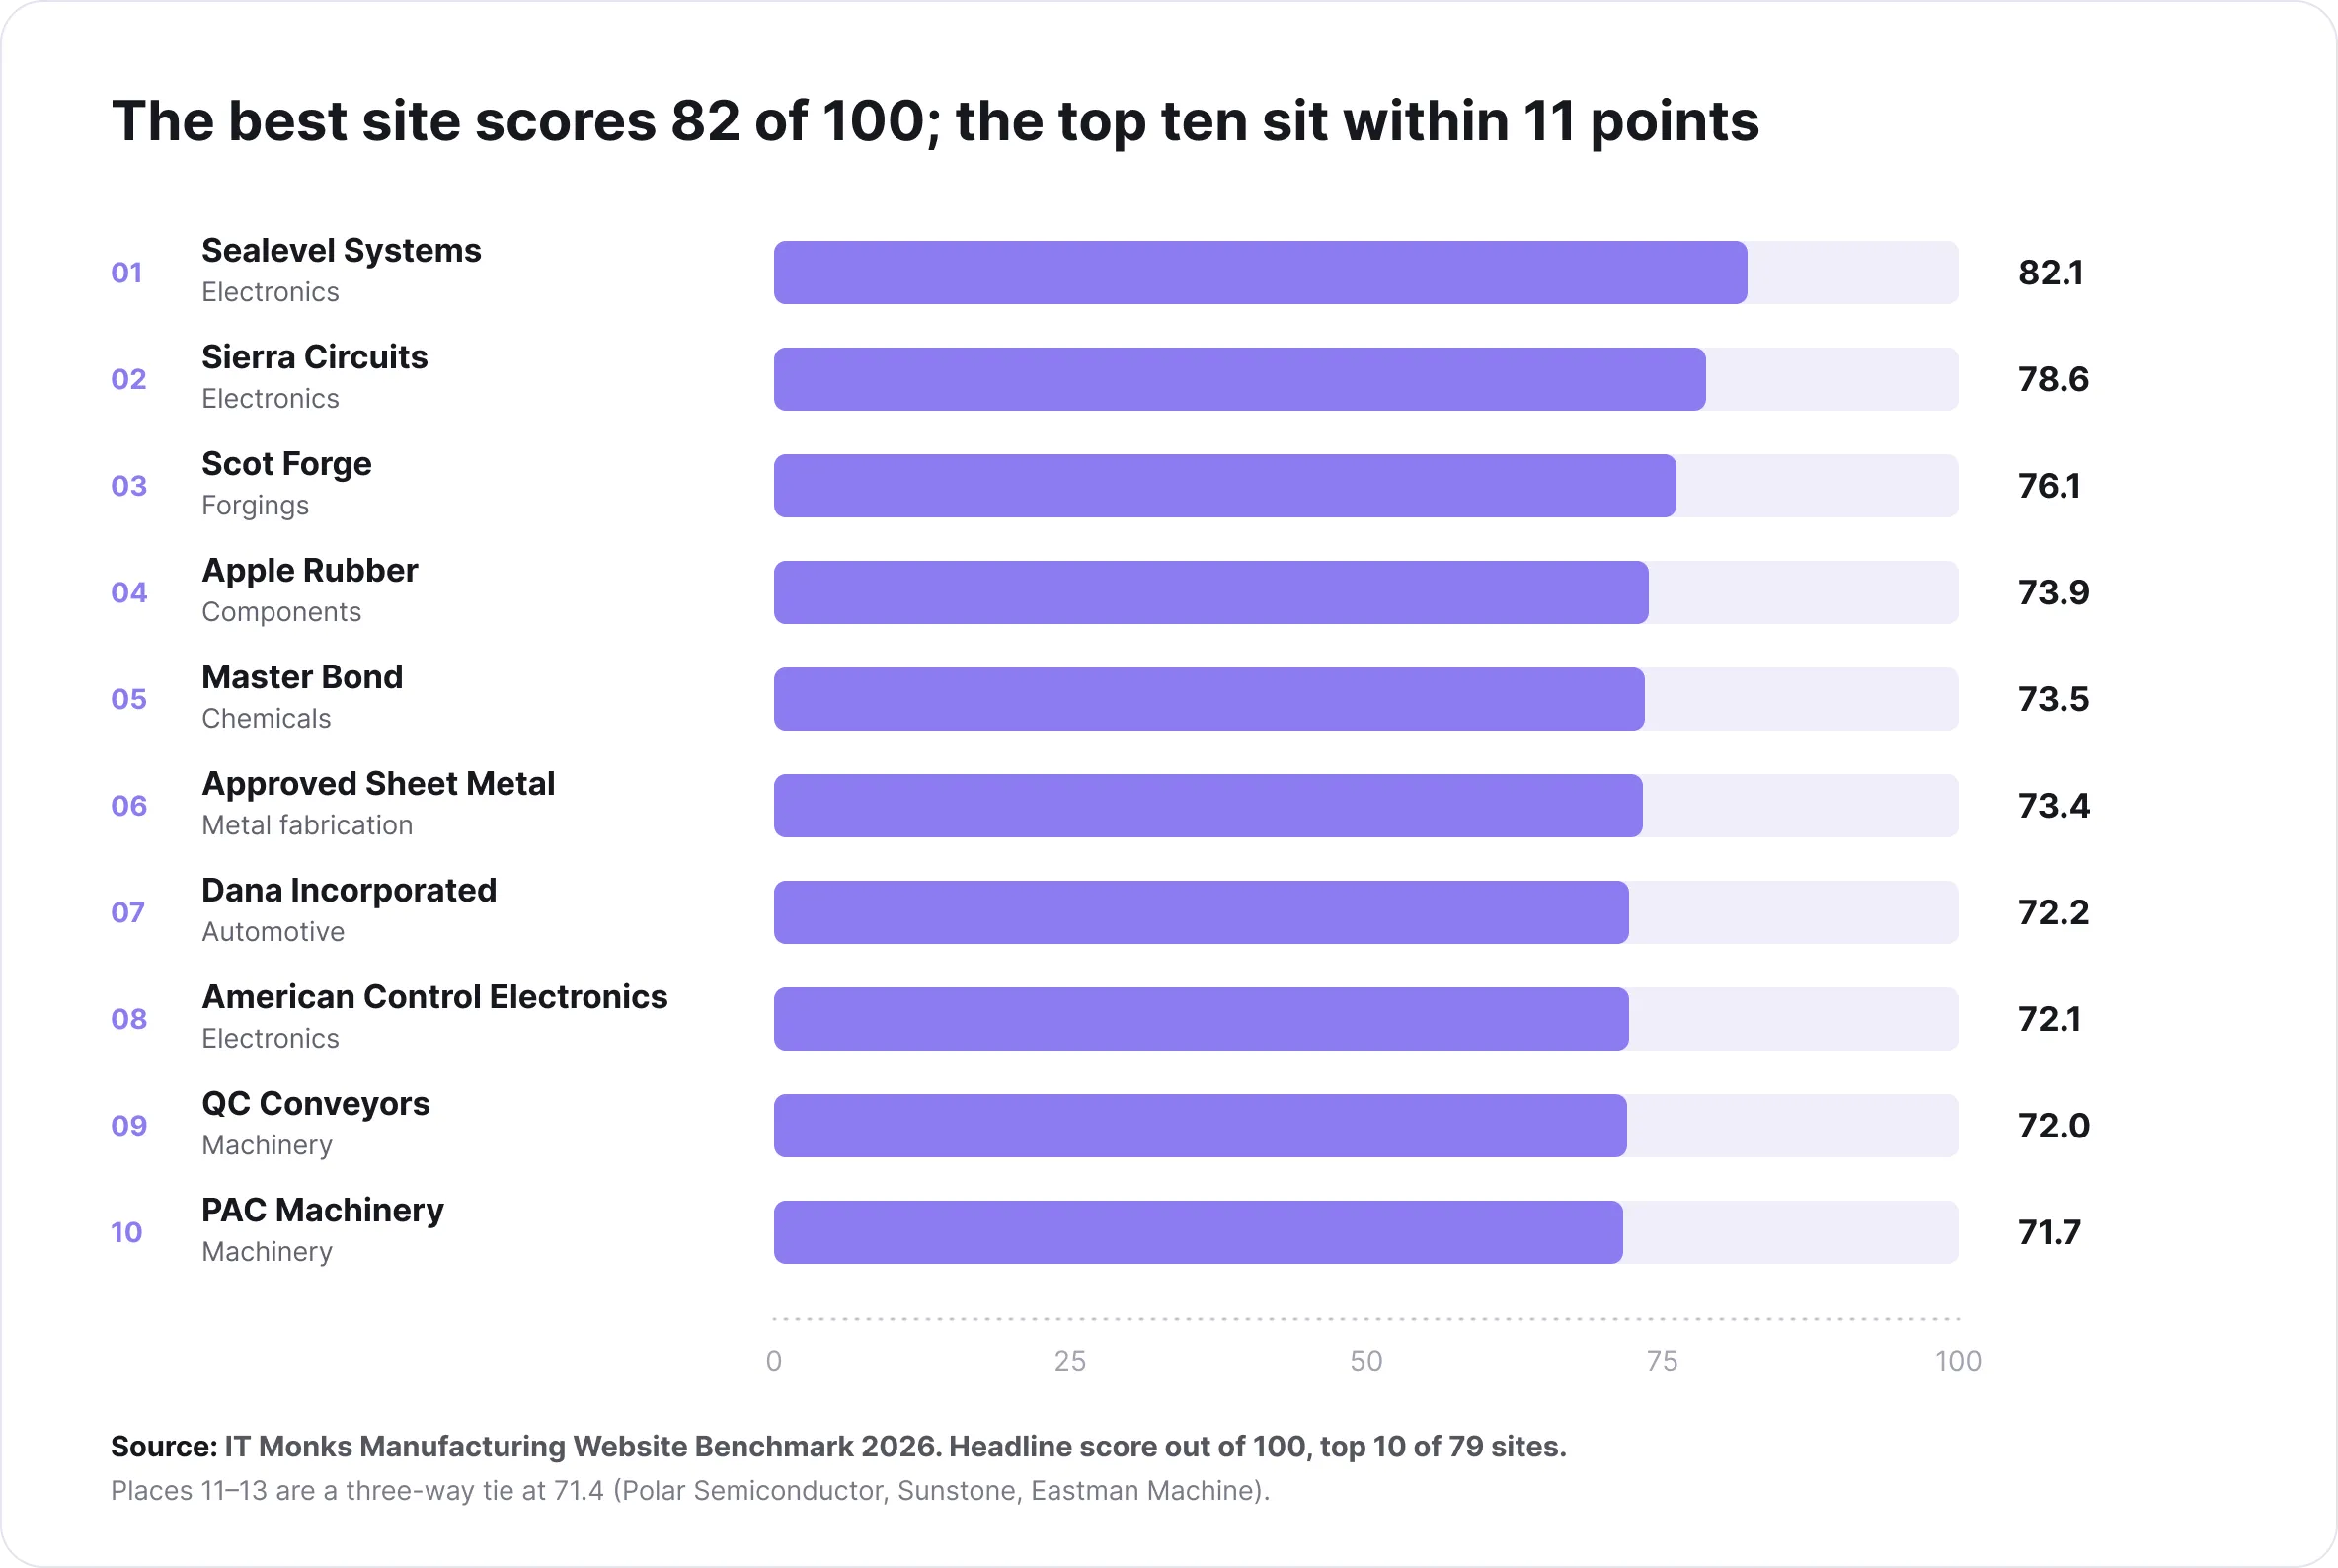
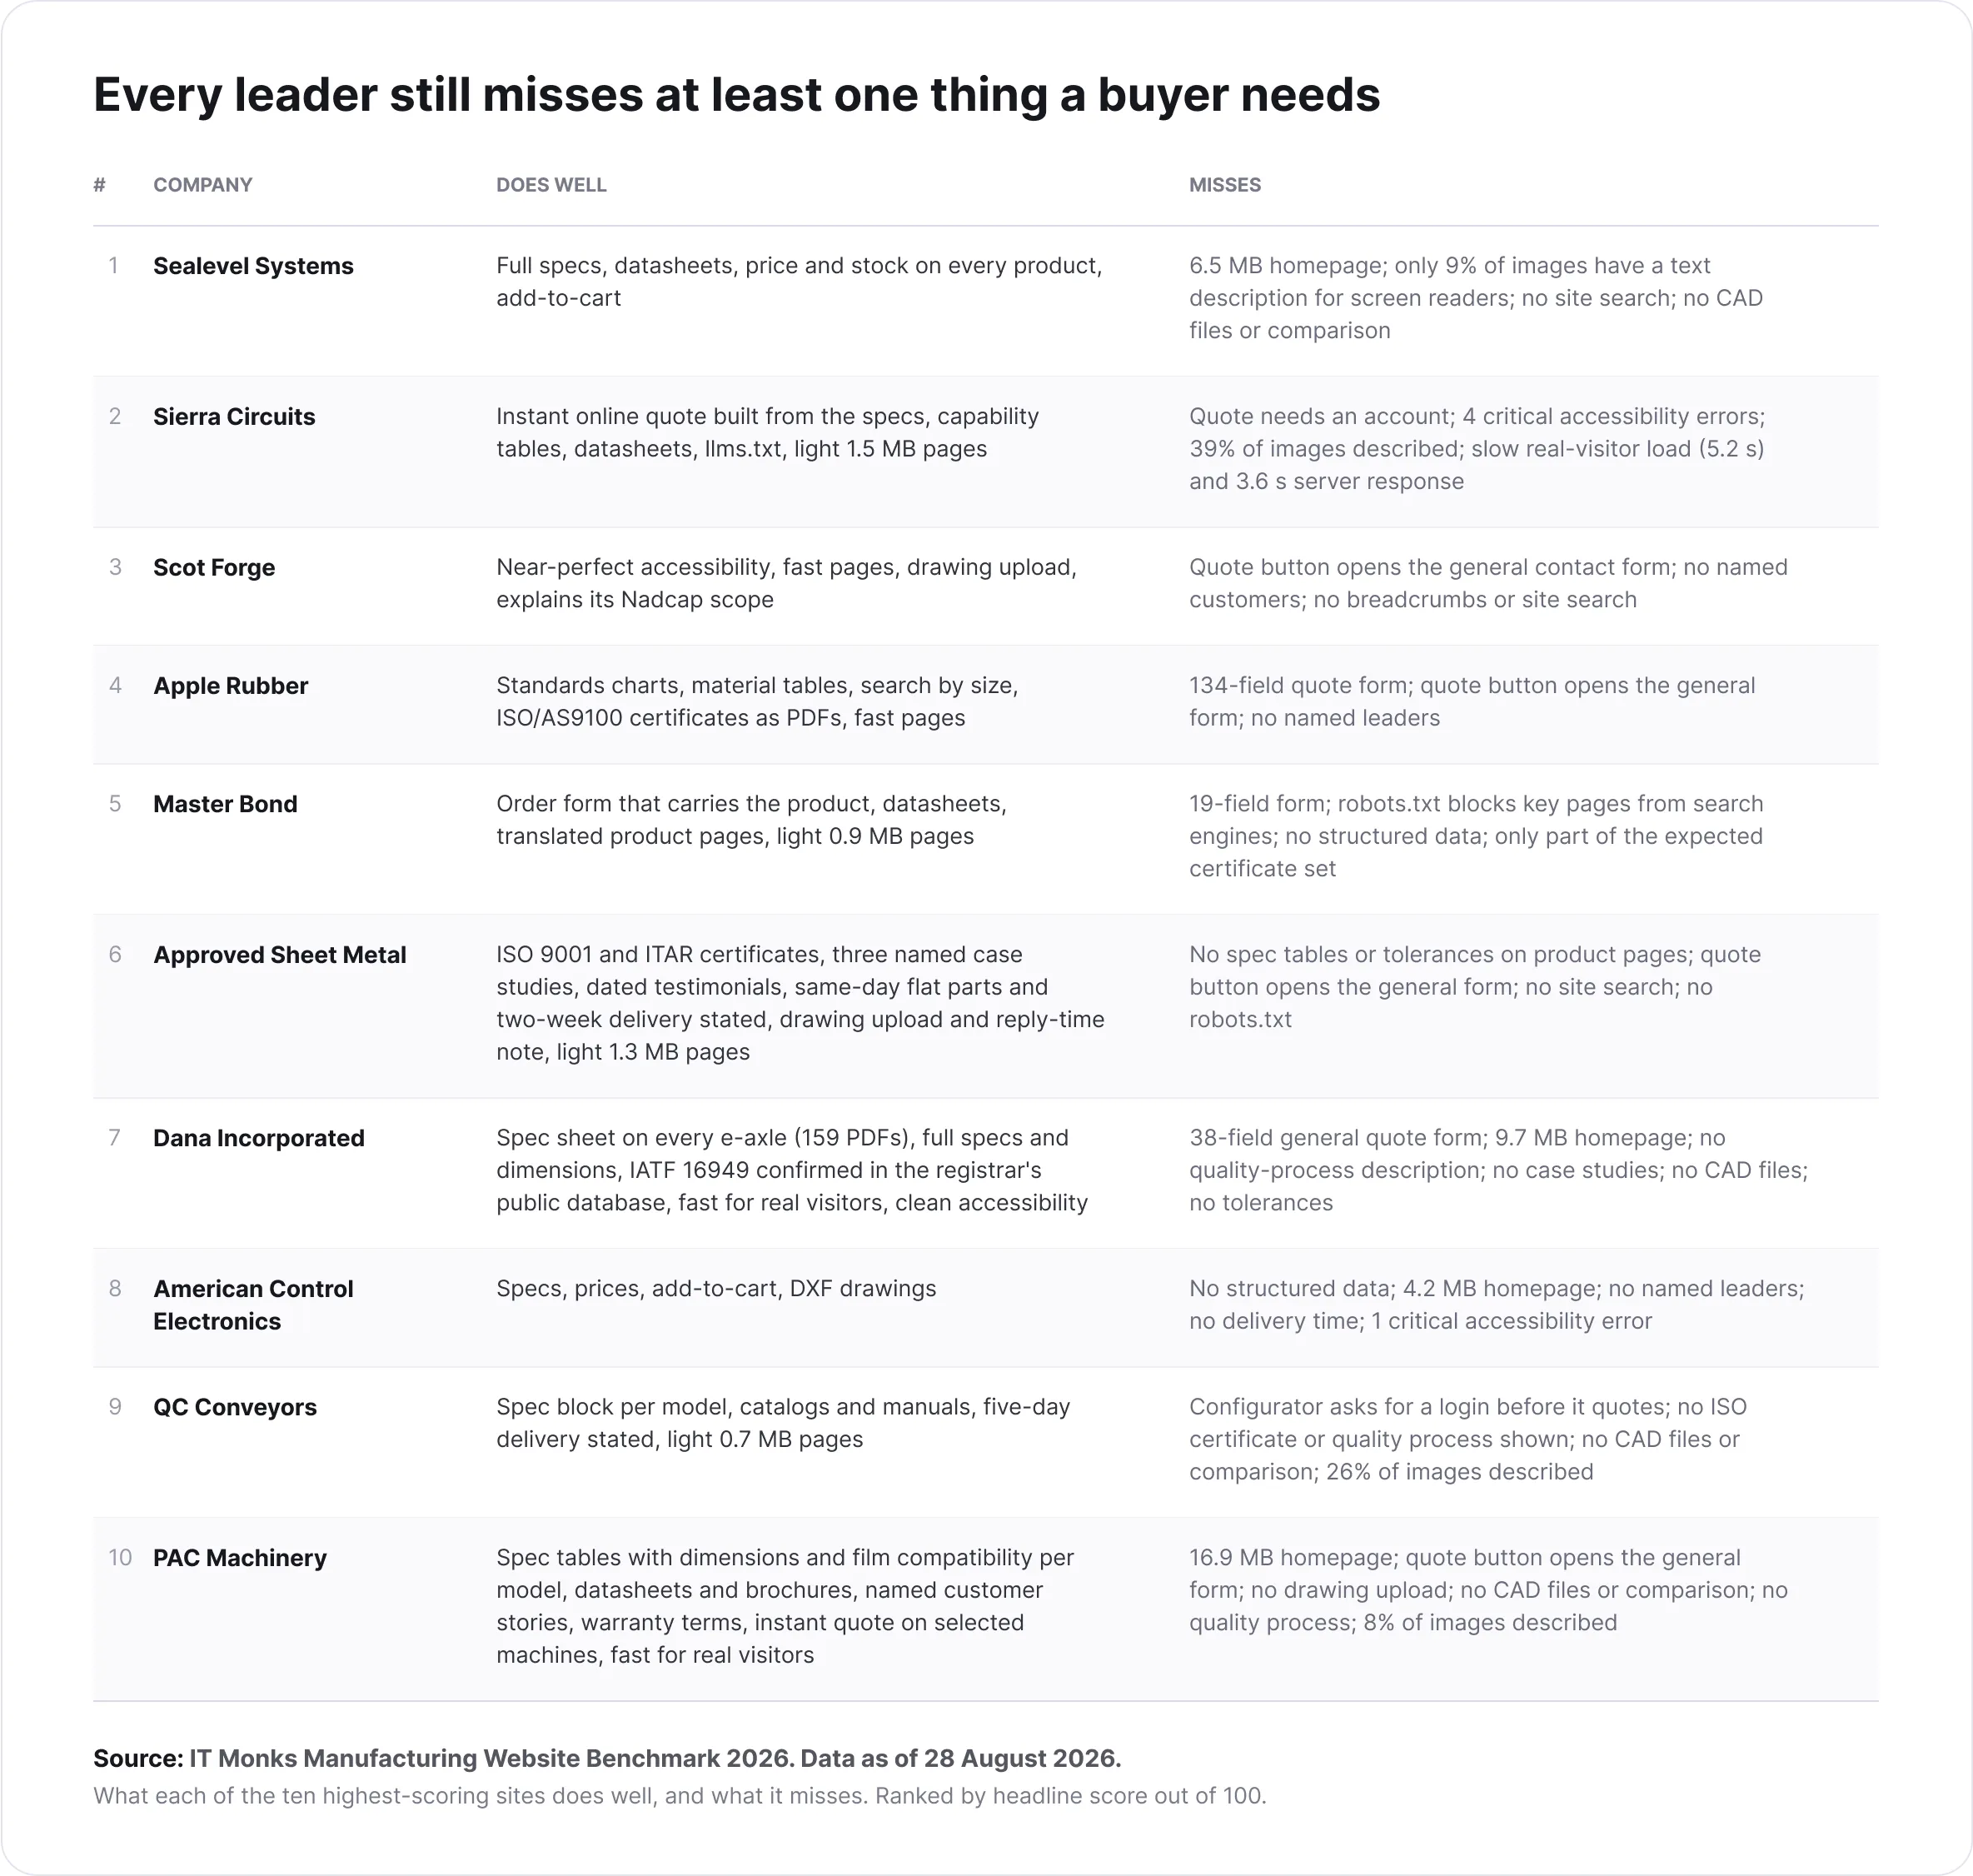
All 10 top-scoring sites show certificates and offer datasheets. But 6 of 10 still send the buyer to a general form for a quote, and 4 of 10 have a homepage over 4 MB. The best score was 82.1 out of 100.
Definitions
Seven terms used on this page
AI is changing how people discover and evaluate brands, and marketing teams need clear visibility into it.
01
Catalog site vs. made-to-order shop
A catalog site sells finished products you pick from a list: a conveyor model, a spring, a circuit board. A made-to-order shop builds parts to the customer’s own drawing and has no product list. Some checks only make sense for catalog sites (filters, comparison, CAD files, delivery time). When a figure says “of 37 catalog sites”, that is why. In this group: 37 catalog sites, 42 made-to-order shops.
02
Spec table
The block of numbers on a product page: size, weight, material, load, voltage, temperature range.
03
Datasheet
A PDF with the full specifications that a buyer can download and keep.
04
CAD file
A 2D or 3D drawing file (STEP, DWG, IGES) an engineer drops straight into their own design. Expected from catalog sites that sell parts, equipment or electronics; not expected from chemical, packaging or made-to-order companies.
05
Quote button that knows the product
A “Request a quote” button on a product page that carries the product into the request: a form that already names the part, an “add to quote” basket, or an add-to-cart button. The opposite: a button that opens the site’s general contact form.
06
Certificates the industry expects
The quality certificates a buyer in that industry looks for first. ISO 9001 in every industry; AS9100, ITAR and Nadcap for aerospace; IATF 16949 for automotive; ISO 13485 for medical; UL, IPC and RoHS for electronics; ISO 14001 and REACH for chemicals. Each site was judged against its own industry’s list.
07
Core Web Vitals
Google’s three speed and stability measurements, taken from real visitors’ phones and computers. “Fail” means at least one is over Google’s limit. Google confirms these are used by its ranking systems (Google Search Central).
Market context
Engineers do most of their research on the website before they talk to sales
Three independent studies describe the buyer this benchmark is built around.
0%
of the buying journey happens online before the engineer first contacts a vendor
So the website has to answer three questions on its own: Does this part fit? Can I trust this company? How do I get a price? If it cannot, the buyer goes to a competitor’s site that can.
Overview
The buyer journey has two weak points: the speed at the start and the quote at the end
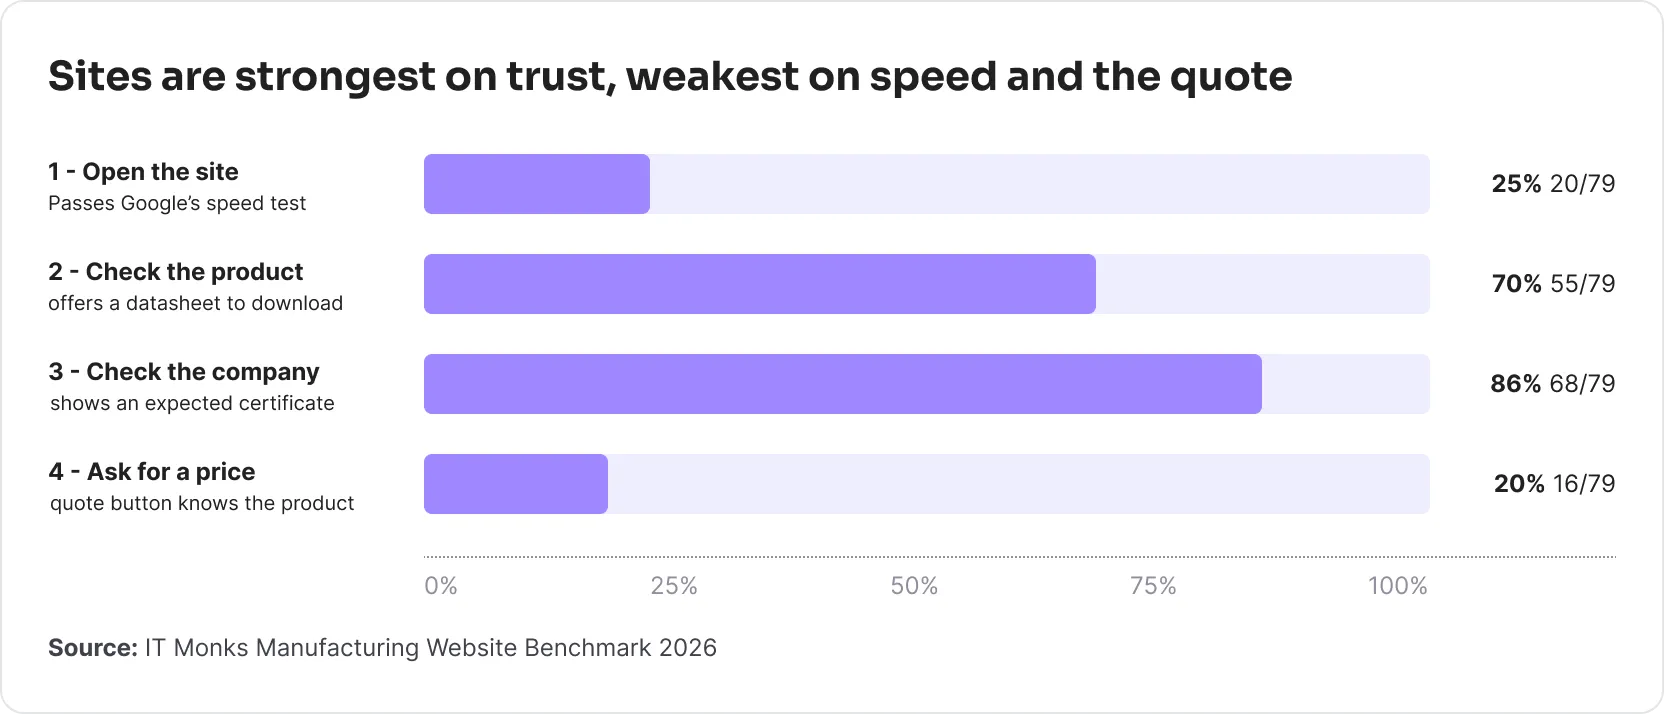
Share of the 79 sites that pass one representative check at each of the four steps a buyer takes.
Sites are strongest on the trust basics: most show a certificate. They are weakest at the two ends of the journey. Three in four fail Google’s speed test, and four in five send the buyer to a generic form at the moment they want a price.
Step 1 · Open the site
The basics are in place; speed is not
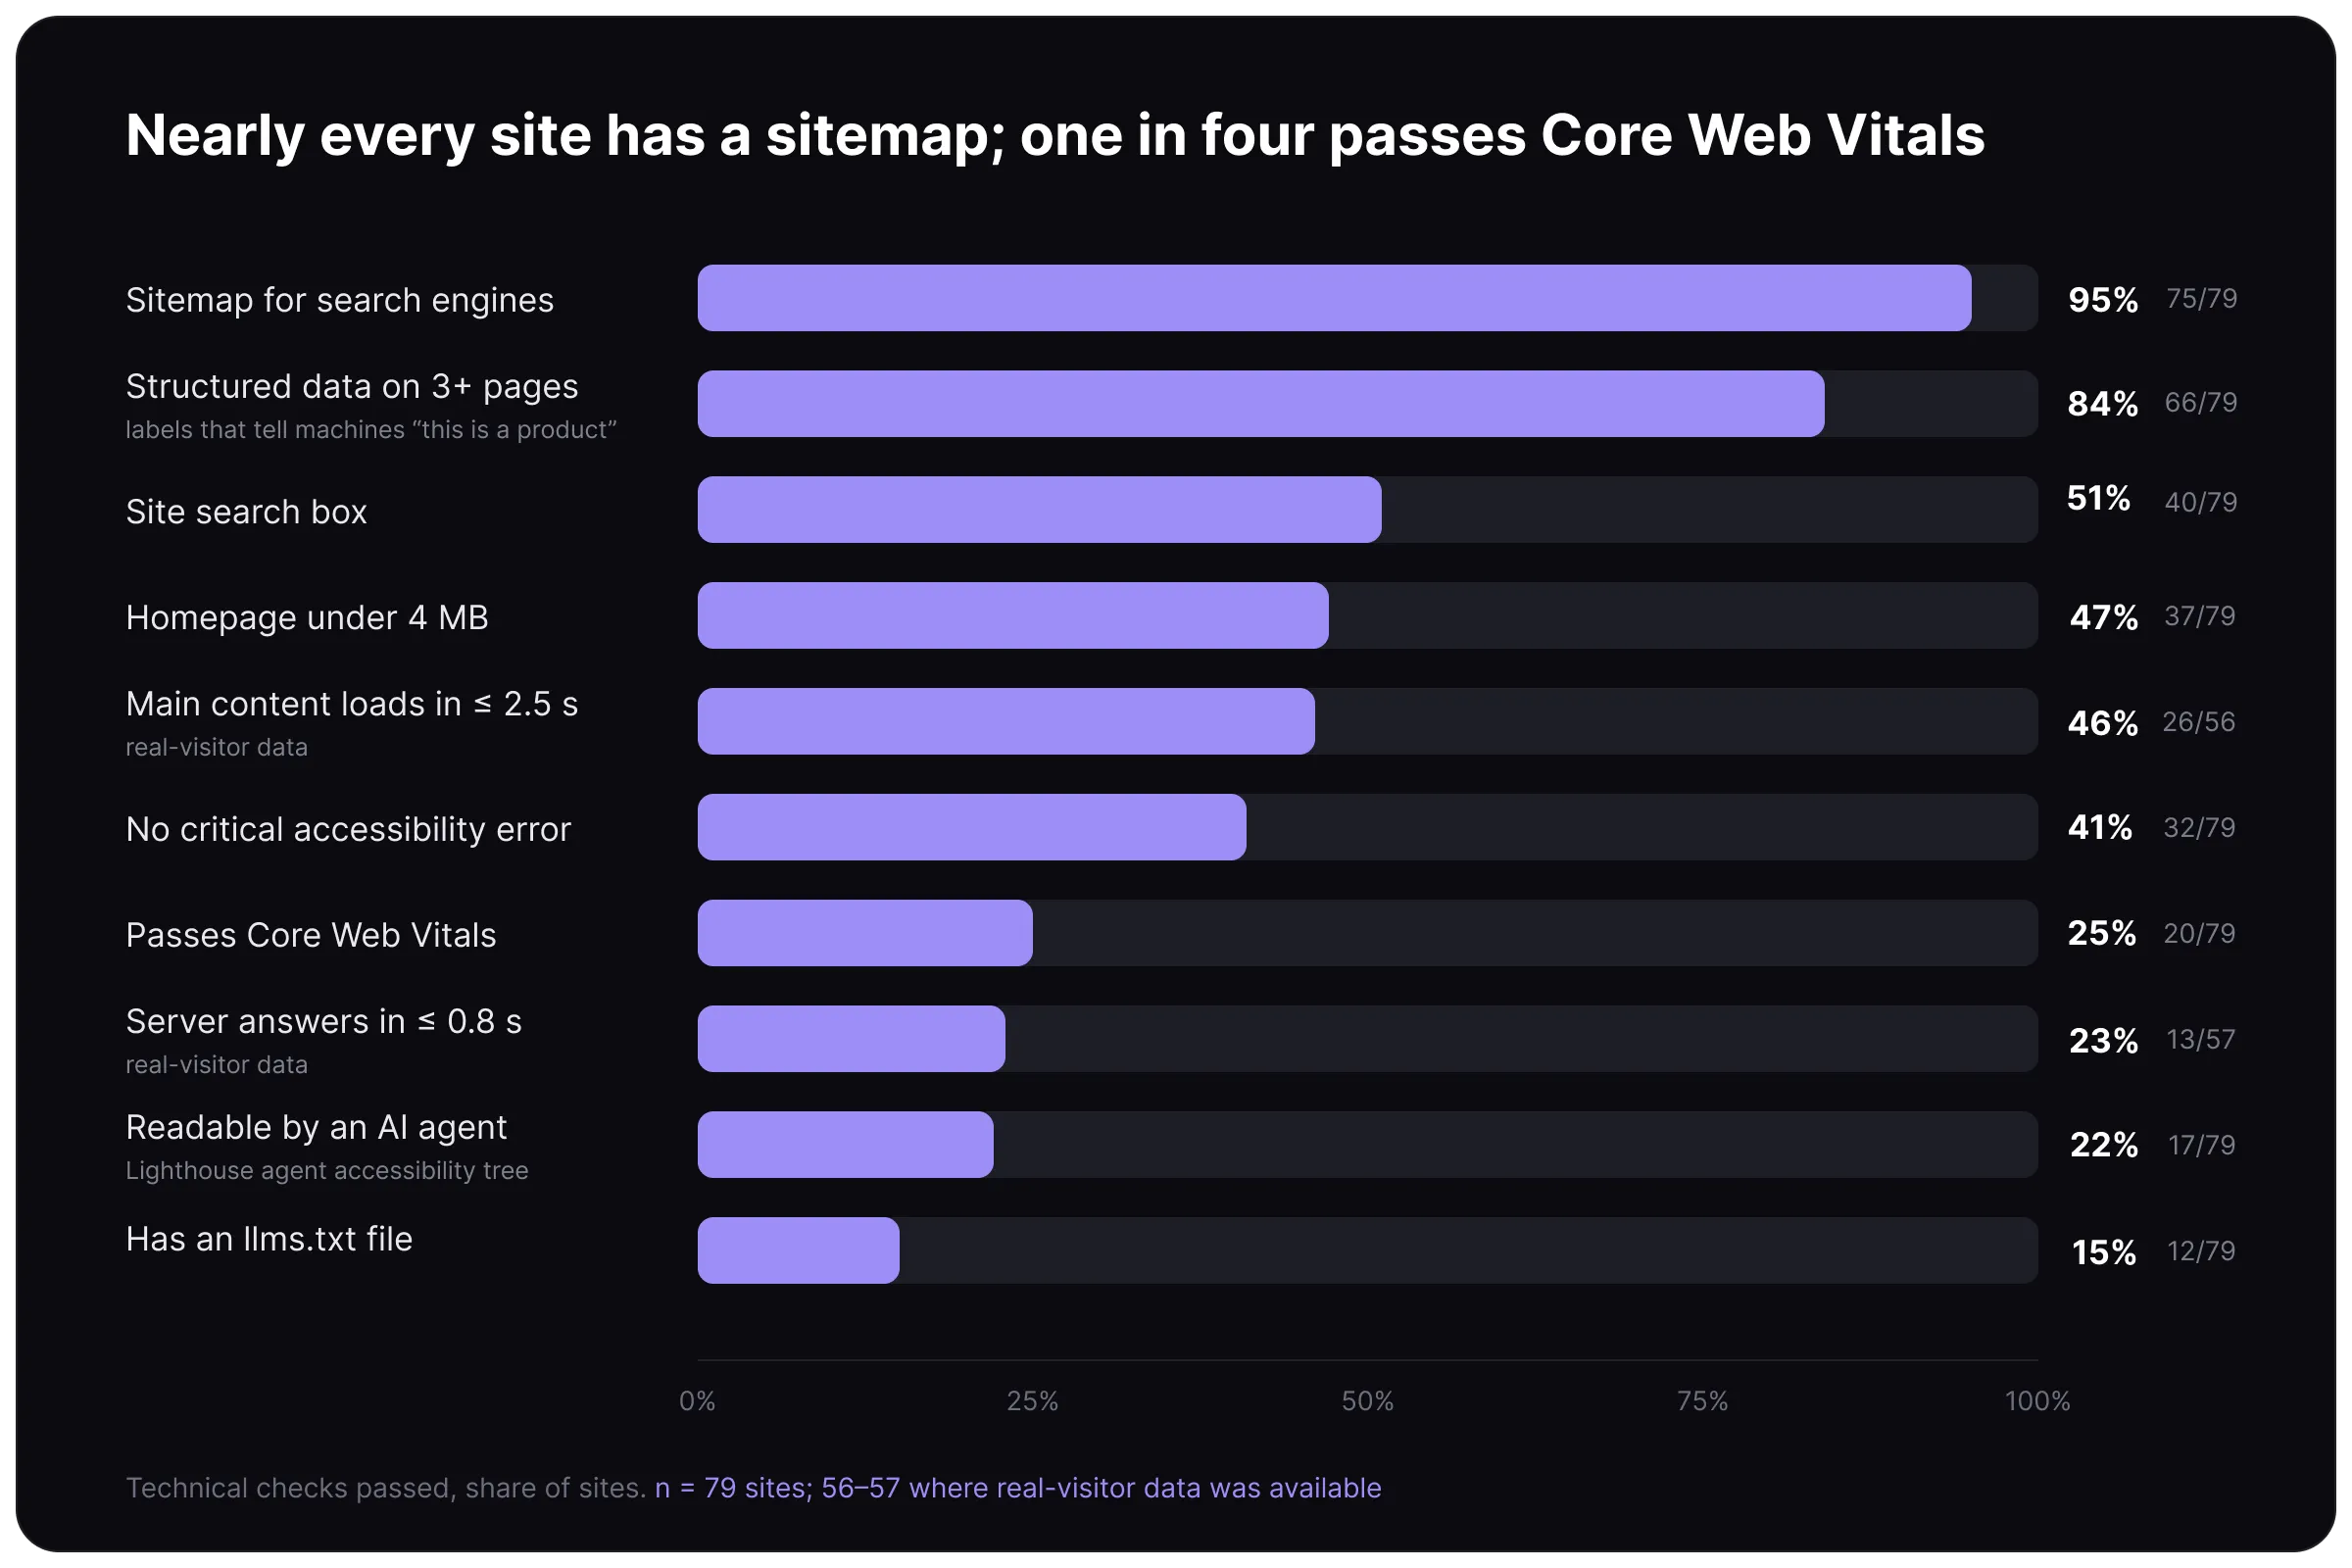
“Can I open and use this site on my phone?” Share of sites passing each technical check.
0 s
typical time until the main content appears on a phone (median). Google's limit for "good" is 2.5 s.
What this means. The typical site is just slower than Google wants. Servers are slow to answer: only 13 of 57 send the first byte within Google’s 0.8-second target (web.dev). 42 of 79 homepages weigh more than 4 MB. For scale, the median mobile home page on the web was 2.6 MB in July 2025, so these pages carry more than one and a half times the typical load (HTTP Archive Web Almanac 2025). We did not prove that weight causes the slow loads: heavy and light sites had similar load times.
Accessibility. 47 of 79 sites have at least one critical accessibility error (a missing form label, an unnamed button, a broken ARIA reference). That is in line with the web as a whole: WebAIM’s February 2026 scan of the top one million home pages found WCAG failures on 95.9% of them, 56.1 errors per page on average (WebAIM Million 2026).
Can an AI assistant read the site? 45% of B2B buyers used AI during a recent purchase (Gartner, 2026) and 10% of engineers already list generative AI among the places they routinely look for product information (GlobalSpec 2025, p. 11). We ran Google’s own check for this, the Lighthouse “agentic browsing” audit (Chrome for Developers). It looks at the accessibility tree, the page structure a machine reads, which Google calls the agent’s “primary data model” (17 of 79 pass), and for an llms.txt file, a short text summary of the site at its root (12 of 79 have one). One caveat: llms.txt is a community proposal (llmstxt.org); Lighthouse checks for it, but Google’s John Mueller said in June 2025 that “no AI system currently uses llms.txt” (Search Engine Roundtable). We report it because Google’s audit does; it is a cheap signal, not a proven ranking factor.
Step 2 · Check the product
The spec table is there; the datasheet, CAD file and comparison often are not
“Will this product fit my job?” Share of sites offering each piece of product information, among the sites where the check applies.
What this means. An engineer needs four things: dimensions, tolerances (how exactly the part is made, for example ±0.05 mm), materials, and ideally a drawing file. Most sites show the numbers on the page. Everything beyond the table is thinner. In plain terms: you can read the numbers, but you often have to call to get the file.
Why "call us for the file" costs sales
Engineers rate the datasheet as the most useful thing a supplier can publish (79%).
The CAD file is where the sale is decided. In a survey of 2,563 designers and engineers, 92% said they prefer suppliers that provide CAD models. 54% are ready to switch supplier if theirs does not. 90% of the parts they download end up being purchased (TraceParts, 2021).
An earlier survey of engineers at 500+ companies found that one downloaded CAD model leads to a production purchase of 16.7 parts on average (CADENAS PARTsolutions, 2015).
Both CAD surveys come from companies that sell CAD-catalog services, so treat the exact figures as an upper bound. The independent GlobalSpec data confirms the direction.
Best and worst. Century Spring shows full spec tables, CAD downloads and live stock levels for same-day shipping. At the other end, 3 of the 14 auto, aerospace and defense sites show no usable specifications at all.
Step 3 · Check the company
One in seven shows none of the certificates its industry expects
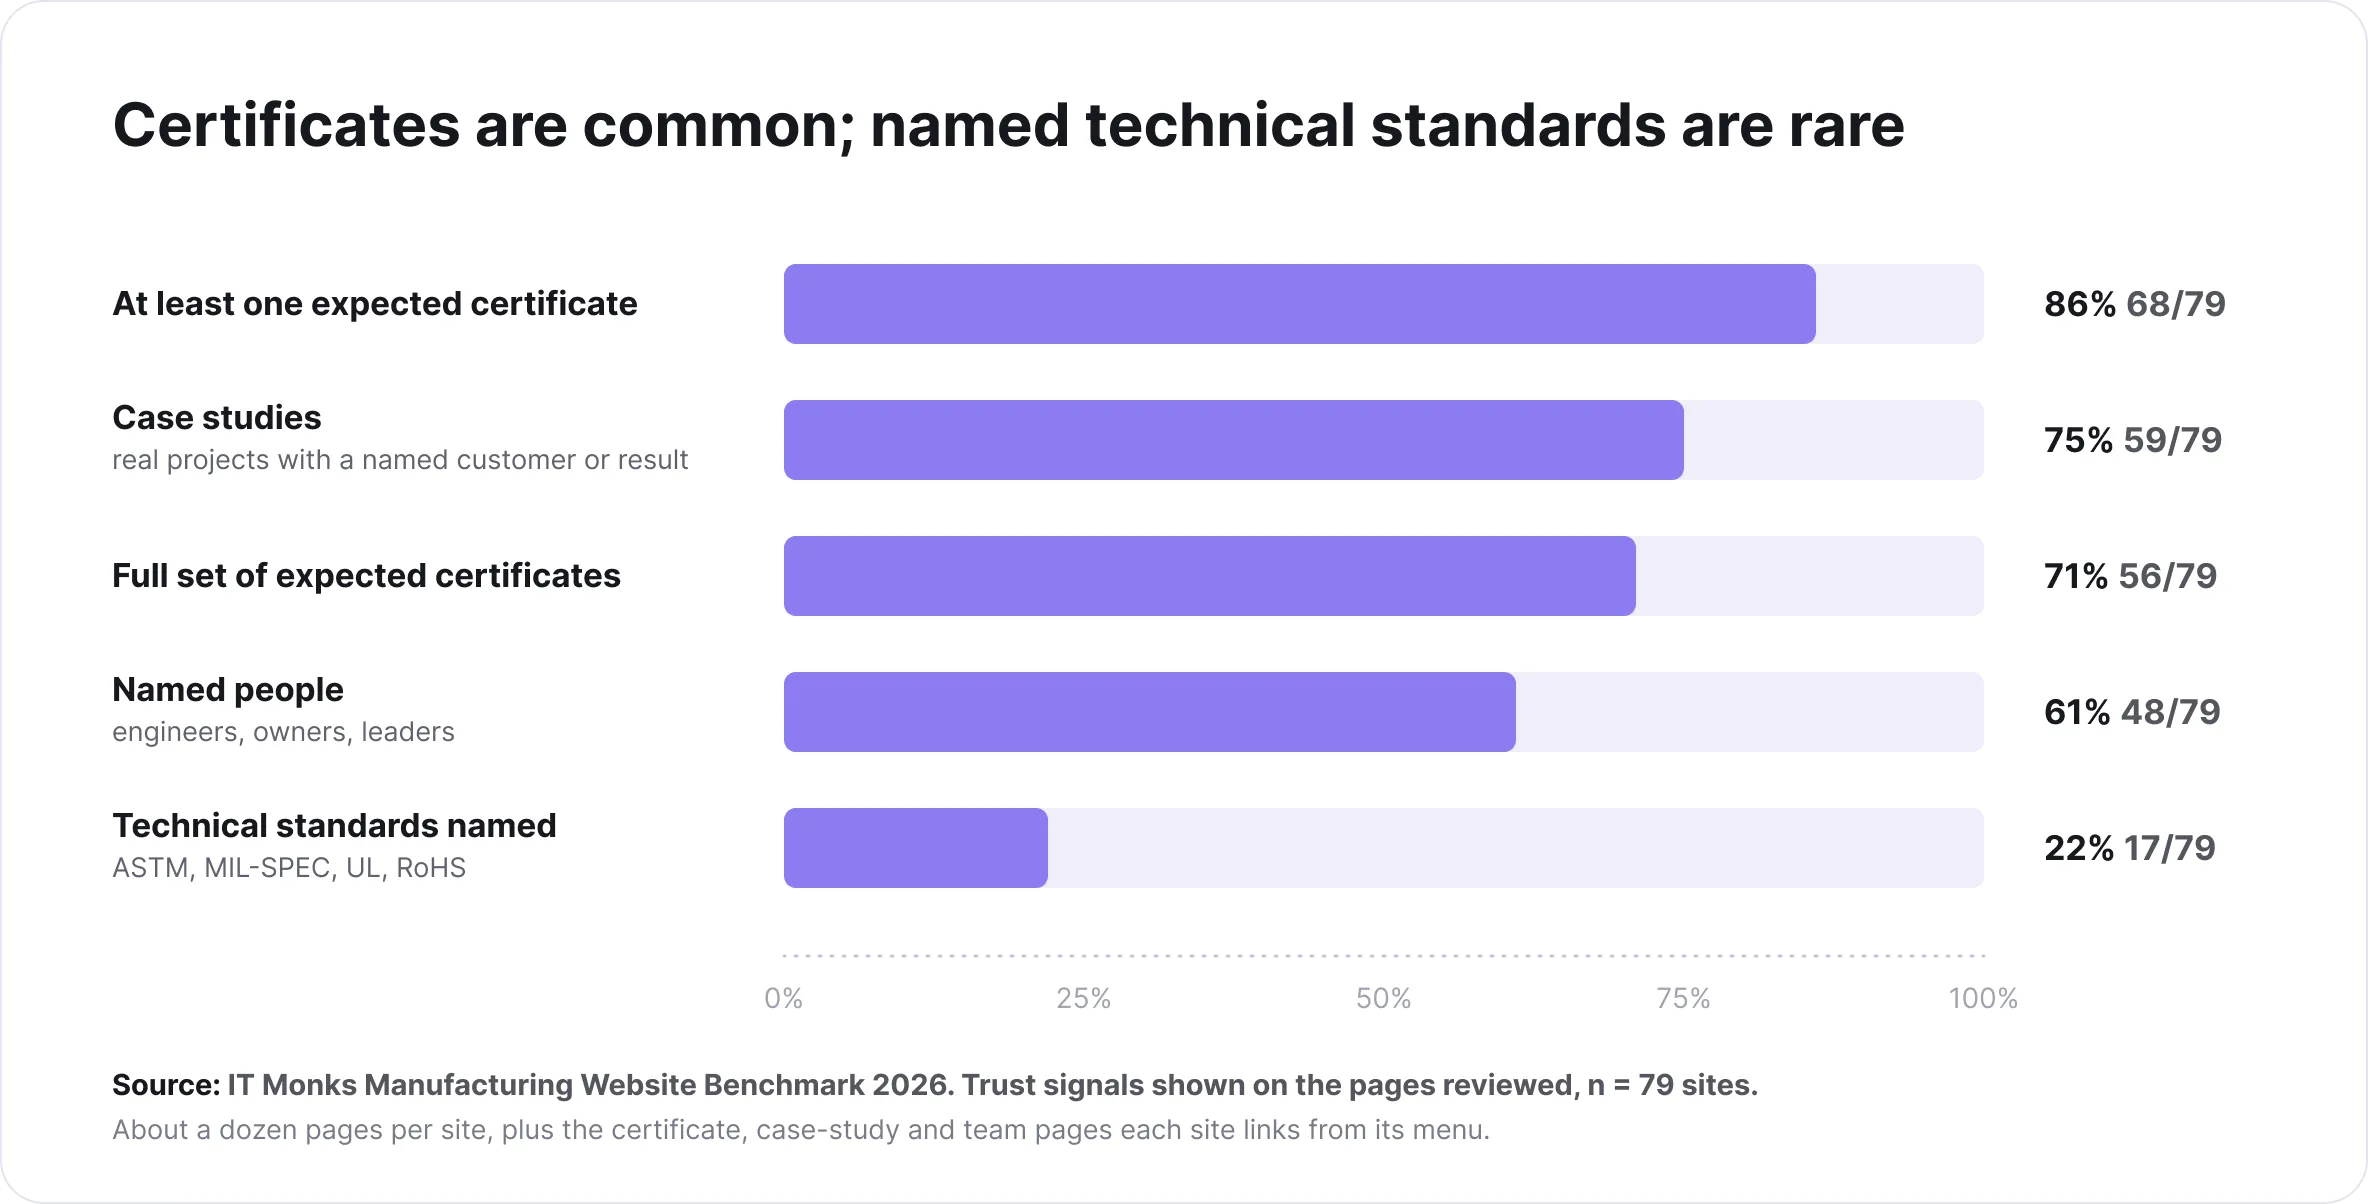
“Can I trust this supplier?” Share of sites showing each trust signal on the pages reviewed.
What this means. A buyer qualifies a new supplier by its certificates and by how it describes its quality process. 11 of 79 sites show no expected certificate at all. Two sites still had “lorem ipsum” placeholder text live: one in a homepage testimonial, one on a contact page.
Why this matters
Thomas polled more than 400 registered industrial buyers on what they weigh when shortlisting a new supplier. The top four were availability and lead times, price, quality certifications, and verified company information. Its advice to suppliers: keep certifications “easy to find and always current” (Thomas, 2021).
Engineers rate an informative, well-maintained website as the strongest sign of a credible supplier (4.0 of 5). Next come references from past customers (3.8), case studies with well-known brands (3.6) and affiliation with technical experts (3.5). Nearly a third call technical expertise “extremely important” when judging a brand (GlobalSpec 2025, pp. 37–38).
Certificates, named customers and named engineers are exactly those signals, on the page.
Step 4 · Ask for a price
The site earns the visit, then sends the buyer to a general form
“How do I get a quote for this product?” What happens when a buyer presses “Request a quote” on a product page, all 79 sites.
What this means. Only 16 of 79 sites let a buyer ask for a quote from the product page in a way that carries the product along. 19 sites ask for 15 or more form fields. 6 of the 10 top-scoring sites have no product-aware quote button: Scot Forge (ranked 3rd) sends the buyer to the general contact form; QC Conveyors (9th) asks for a login before its configurator will quote.
Why each of these matters
Form length. The closest large-scale research is Baymard’s checkout testing. The average checkout asks 11.3 fields, and most sites need only 8. 17% of users have abandoned a purchase because of checkout complexity (Baymard Institute, 2024). A 15-field quote form is longer than the average online checkout.
Reply time. Harvard Business Review audited 2,241 U.S. companies. Firms that contacted a web lead within an hour were nearly seven times as likely to qualify it as firms that waited one hour more. They were more than 60 times as likely as firms that waited a day. 23% never responded at all (HBR, March 2011). Industrial buyers expect an answer in under 24 hours. One purchasing manager told Thomas: “If I have to follow up twice, I eliminate you from consideration” (Thomas, 2021).
Delivery time. In that same poll, availability and lead time ranked as the single most important factor when choosing a new supplier, ahead of price.
Breakdown by industry
Who does what, by industry
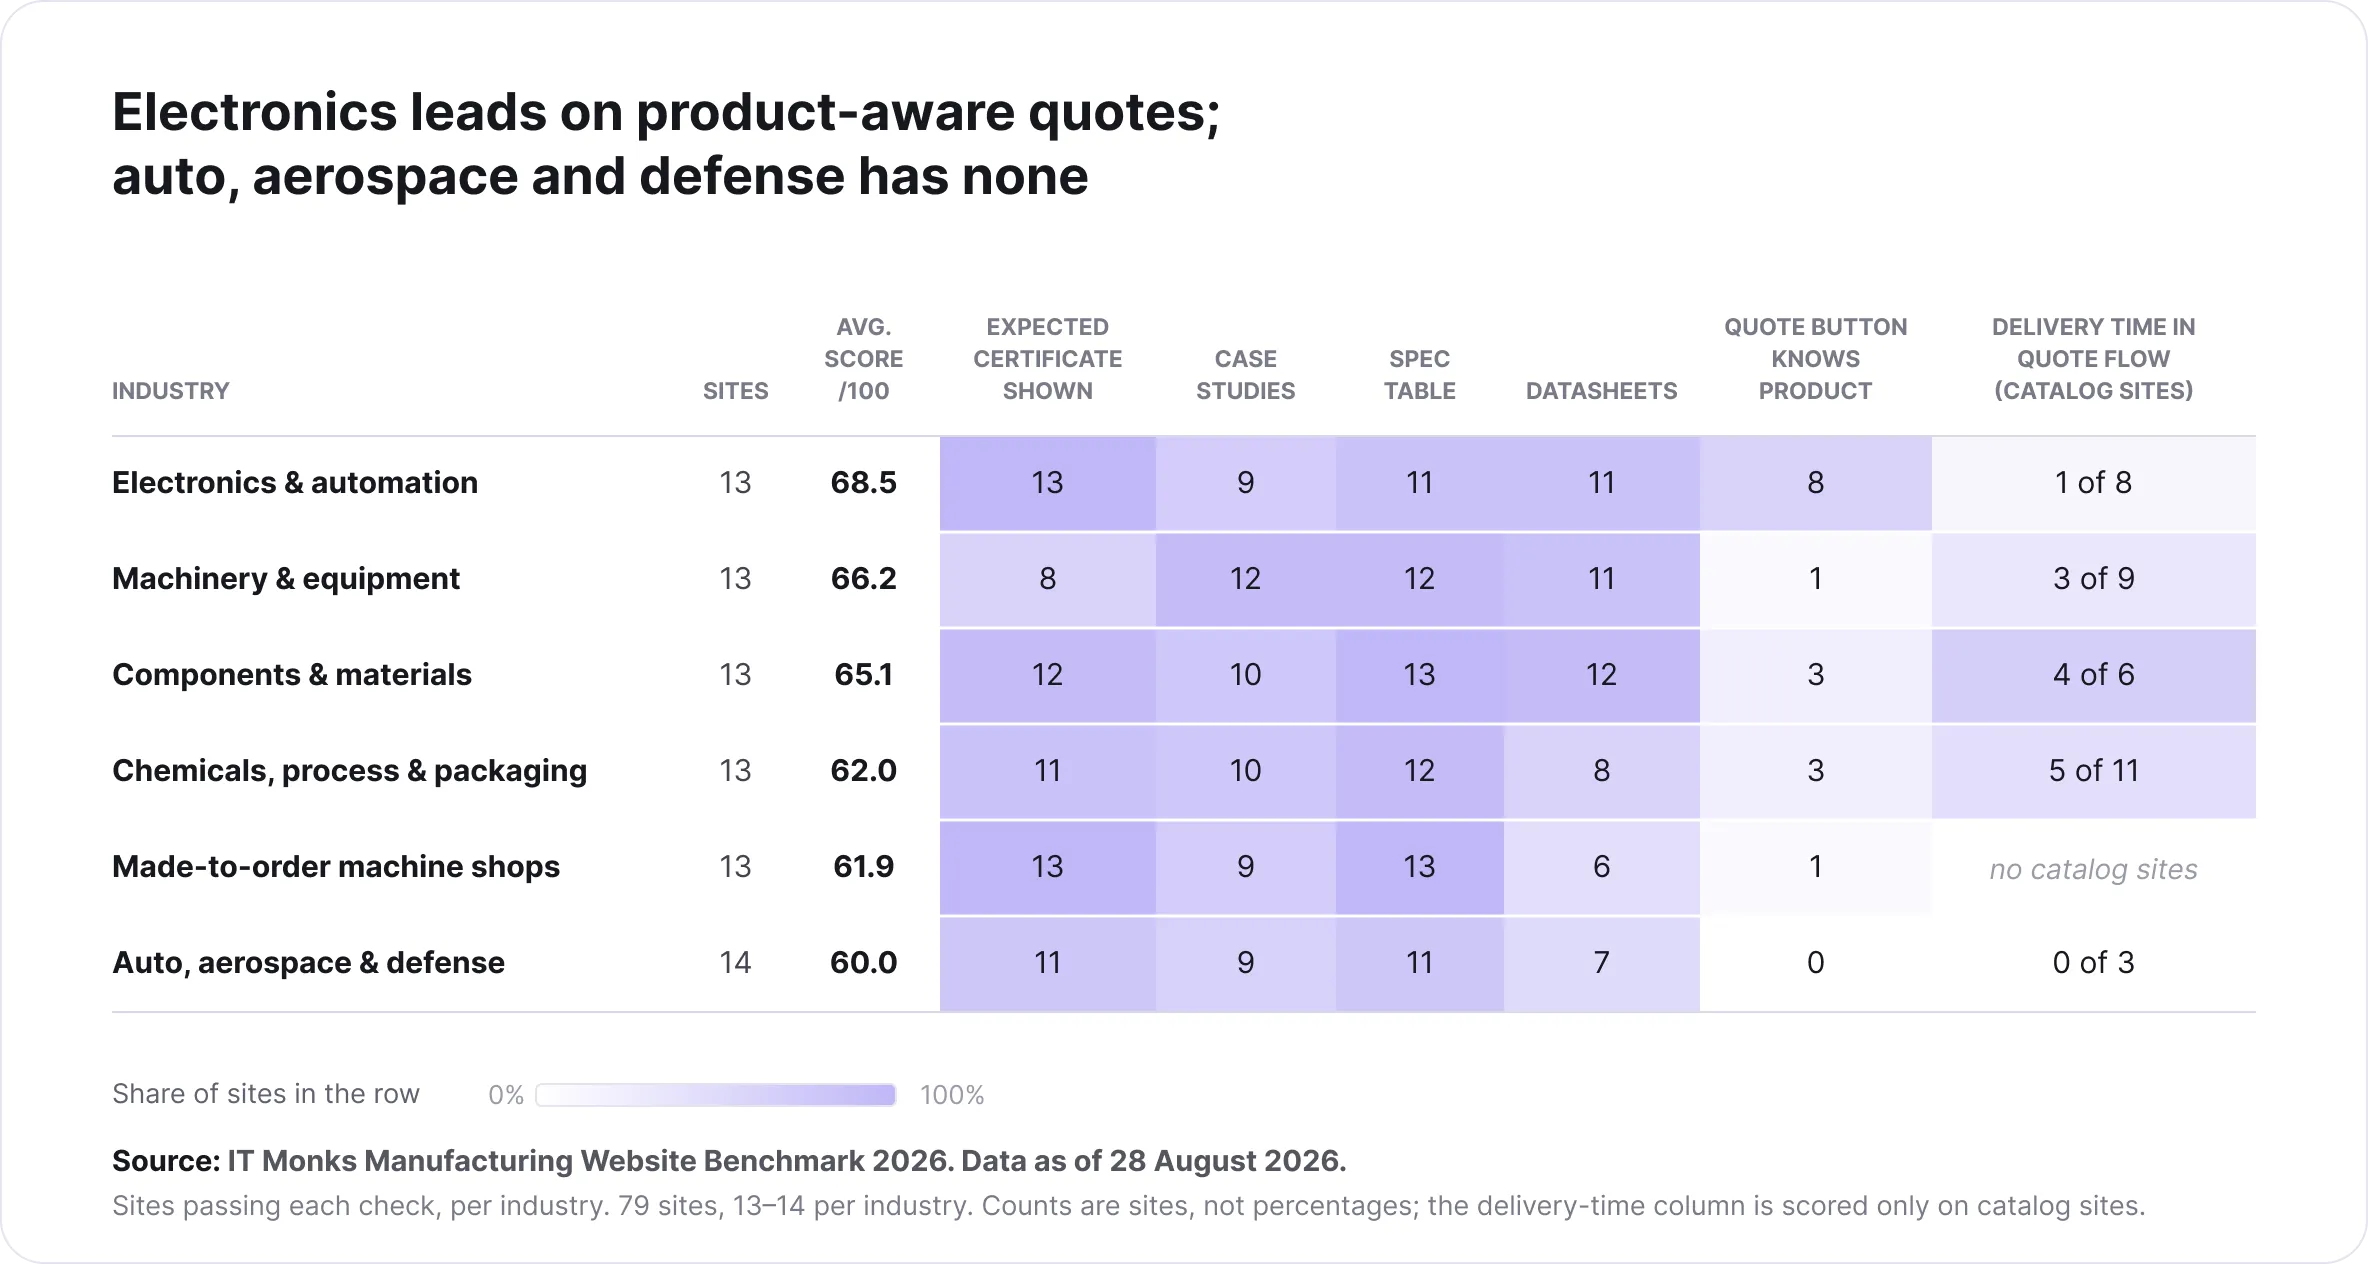
Number of sites in each industry that pass each check. A stronger blue = a larger share of that industry’s sites (see the scale under the table). Read each cell as “this many of the sites in that row”.
Electronics & automation scores highest (68.5): 8 of its 13 sites have a quote button that knows the product, the most of any industry. Machinery & equipment (66.2): 12 of 13 show case studies. Components & materials (65.1): 12 of 13 show expected certificates and offer datasheets. Chemicals, process & packaging (62.0) sits in the middle: 11 of 13 show at least one expected certificate, but only 7 of 13 show the full set. Made-to-order machine shops (61.9) show what they are good at: all 13 show certificates, but only 1 has a product-aware quote button; none is a catalog site, so filters, comparison and delivery-time checks do not apply. Auto, aerospace & defense scores lowest (60.0): 3 of 14 show no specifications at all, and none has a quote button that knows the product.
Breakdown by company size
Small companies score slightly higher than large ones
59 small and 20 large companies, split at the U.S. Small Business Administration’s size limit for each industry (500 to 1,500 employees).
Company size did not buy a better website. Small companies more often did the two things buyers ask for first: a quote button that knows the product and visible certificates. Large companies more often named their people.
Breakdown by ranking
The ten highest-scoring sites
Headline score out of 100. Every site is measured on the same 78-point core, scaled to 100, so the ranking is comparable across business models.
Breakdown by opportunity
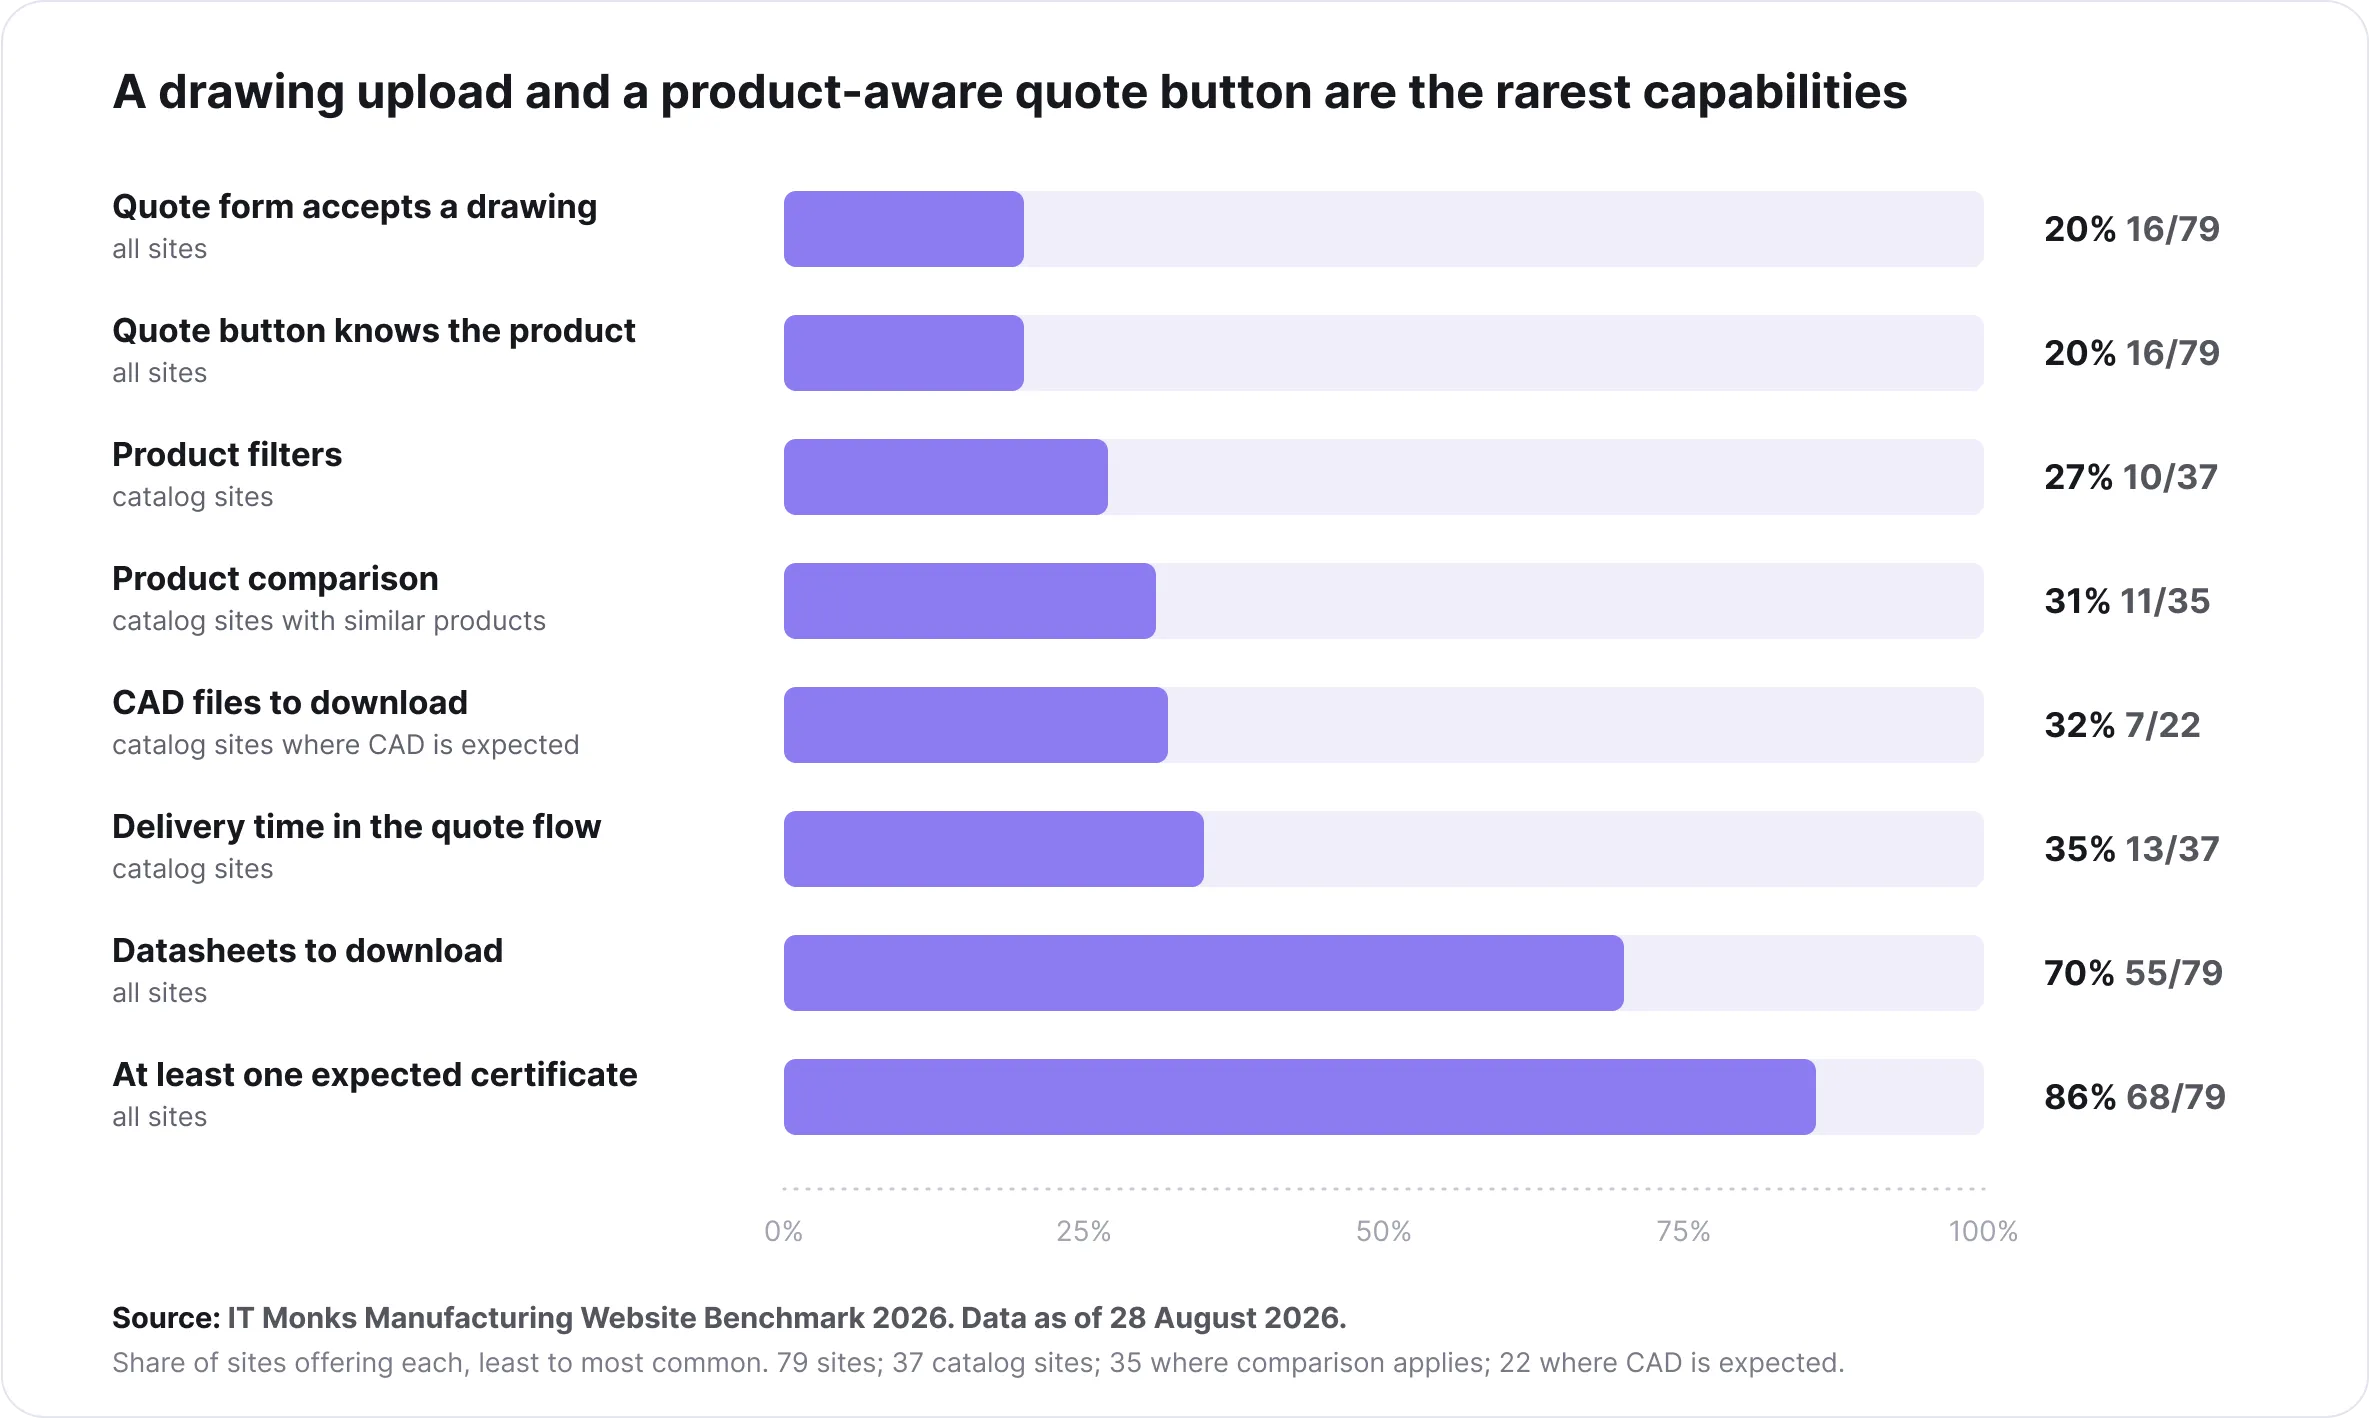
The things buyers need that the fewest sites offer
Share of sites that offer each capability, counted among the sites where the check applies. A short bar is a big chance to stand out.
No site in the group does all five of these on the open page: a spec table, a datasheet, a quote button that knows the product, a drawing upload, and a stated delivery time. One site (Venango Machine) does the first four. A manufacturer that does all five would be alone in this group.
Recommendations
What a great manufacturer website does
A great site answers all four buyer questions on the open page, with no phone call needed. Very few do.
It loads under 4 MB and passes Google’s speed test. Every product page has a real spec table and a one-click datasheet (plus a CAD file, for catalog parts). Certificates, the quality process and named projects sit one click from the homepage. And a “Request a quote” button on every product carries the product name, accepts a drawing and states the delivery time. Sealevel, Sierra Circuits and Scot Forge each do most of this. None does all of it.
01Do first
Real spec tables. Datasheets and CAD files to download. A quote button that knows the product and accepts a drawing.
02Do second
Certificates, a short quality-process description, named case studies, a stated delivery time and reply time.
03Keep fixing
Images under 4 MB per page, Google’s speed test passed, critical accessibility errors cleared.
Why it matters more every year
Buyers, and increasingly the AI assistants they ask, pick the supplier whose website answers the question. Information left off the page is a quote handed to a competitor.
About the data
How we measured, and the limits
Who is in the group
79 U.S. manufacturers. Each one makes physical products in its own plants and sells to other businesses. No distributors, marketplaces or directories. Six industries, 13 to 14 companies each. We picked the group to balance the industries; it is not a random sample of all U.S. manufacturers. Data as of 28 August 2026.
Small vs. large
We use the U.S. Small Business Administration’s size limit for each industry (SBA table of size standards, 13 CFR 121.201). It ranges from 500 to 1,500 employees, so a 750-person electronics company can still count as “small”. Result: 59 small, 20 large. Headcount comes from each company’s own LinkedIn page (69 of 79; 5 of those sit in a range that crosses their limit). The other 10 come from public filings or business directories. The industry code and the size limit used for each company are in the dataset.
Speed and code
Speed comes from Google PageSpeed Insights, judged against Google’s published thresholds (LCP 2.5 s, TTFB 0.8 s). The Core Web Vitals result, the server response time and the 2.6-second median use Google’s real-visitor data (56 sites have it; 57 for server response). The 55/100 PageSpeed score is a lab test. These are two different measurements and we keep them apart. AI readiness comes from Lighthouse’s agentic-browsing test (Chrome 152): can an agent read the page structure, does the layout stay still, is there an llms.txt file. We left out the experimental WebMCP checks, and we count a missing llms.txt as a fail. Accessibility counts distinct axe-core rule failures on the homepage and one product page, taking the worse of the two: zero critical errors allowed, up to three serious ones.
Product, quote, trust
An AI reviewer read each site’s product, quote, certificate and resource pages in full, against a fixed 45-point checklist. Every score points to a quoted passage or a page signal. Anastasia Casim and Dima Osmichenko tested each site’s accessibility by hand (keyboard, focus, contrast) and set the three business-model marks per site that decide which checks apply: catalog site or made-to-order shop; product type; sells direct from the U.S. or through export offices and distributors. Content scores are machine-read; accessibility interaction scores and business-model classification are human.
Why some figures are "of 37" or "of 22"
Some checks only apply to some business models, and the figure says so each time. Core Web Vitals and the load time are of the 56 sites with real-visitor data (57 for server response). Filters and delivery time in the quote flow are of the 37 catalog sites. Comparison is of the 35 catalog sites where it applies. CAD files are of the 22 catalog sites that make parts, equipment or electronics. The group is always 79.
The 0–100 score
The headline score uses 78 points that apply to every site regardless of business model: crawlability 8, site structure 6, product decision support 11, quote path 10, trust 16, speed 12, accessibility 12, international basics 3. We scale the total to 100. Checks that depend on the business model are reported separately and never move the headline score: catalog depth (9 points; 76 sites eligible, average 42%), quote depth (3 points; average 27%), and export & channel (7 points; applied to the 31 sites with export offices or distributors, average 45%). Certificates and standards are judged against each industry’s expected list. The dataset records one source page per category per site so anyone can check.
Limits
This is a benchmark screen by tools and reviewers, not a WCAG accessibility audit; automated tools alone cannot certify accessibility (W3C). Content checks cover the roughly 12 pages we read per site plus, for the trust checks, the case-study, capabilities, certificate and leadership pages each site links from its own menu (196 more pages). They do not cover entire websites.
References
Outside research cited on this page
01
TREW Marketing & GlobalSpec, 2026 State of Marketing to Engineers (9th edition, with Elektor): 62% of the buying journey happens online before first vendor contact. Press release, 25 March 2026 · Report page
02
GlobalSpec & TREW Marketing, 2025 State of Marketing to Engineers (over 1,000 engineers; n per question shown in the report): 73% routinely use supplier websites (p. 11, n = 1,002); datasheet 79%, technical article 61%, CAD drawing 37% most valuable content (p. 23, n = 1,018); informative website = strongest credibility signal, 4.0/5 (p. 37, n = 792); on average 60% of the buying process happens online, 72% do at least half online (p. 8, n = 792); 10% routinely use generative AI for product research (p. 11). PDF
03
TraceParts, survey of 2,563 designers and engineers, October–November 2020, published 26 January 2021: 92% prefer suppliers that provide CAD models; 54% ready to look elsewhere if their supplier does not; 90% of downloaded parts are purchased. TraceParts sells CAD-catalog services. Announcement
04
CADENAS PARTsolutions, 2015 Industrial Sales and Marketing Report, survey of engineers at 500+ companies: one downloaded 3D CAD model leads to a production purchase of 16.7 parts on average; about 85% of downloads lead to at least one part purchased. CADENAS sells CAD-catalog services. Press release, 8 April 2015
05
Gartner, survey of 646 B2B buyers, August–September 2025: 67% prefer a rep-free experience; 45% used AI during a recent purchase. Press release, 9 March 2026
06
Thomas (Thomasnet), poll of 400+ registered industrial buyers, 27 May 2021: top factors when shortlisting a new supplier are availability/lead times, price, quality certifications, verified company information; buyers expect a quote answer in under 24 hours. Article
07
Oldroyd, McElheran & Elkington, “The Short Life of Online Sales Leads”, Harvard Business Review, March 2011: audit of 2,241 U.S. companies; contact within one hour = nearly 7× more likely to qualify the lead, 60× versus waiting 24 hours; 37% responded within an hour, 23% never responded. HBR (paywalled)
08
Baymard Institute, “Checkout Optimization: 5 Ways to Minimize Form Fields in Checkout”, 26 June 2024: average checkout 11.3 form fields, most sites need 8, 17% abandoned due to checkout complexity. E-commerce checkout research, used here as the nearest large-scale evidence on form length. Article
HTTP Archive, Web Almanac 2025, Page Weight chapter: median mobile home page 2.6 MB (2,362 KB, July 2025), up from 845 KB in 2015. Chapter
11
WebAIM, The WebAIM Million, February 2026: 95.9% of the top one million home pages have detectable WCAG 2 failures; 56.1 errors per page on average. Report
12
Google Chrome for Developers, Lighthouse agentic browsing scoring: experimental category; audits agent-centric accessibility (accessibility tree as the agent’s “primary data model”), layout stability and presence of llms.txt; no 0–100 score. Documentation · llms.txt proposal: llmstxt.org · Google’s John Mueller, 17 June 2025: “no AI system currently uses llms.txt”. Search Engine Roundtable
13
U.S. Small Business Administration, Table of Size Standards (13 CFR 121.201), effective 17 March 2023. sba.gov
14
W3C Web Accessibility Initiative, Evaluating Web Accessibility: automated tools alone cannot determine accessibility. w3.org
Let's discuss your project
Tell us what’s not working. We’ll tell you what’s possible.



 ChatGPT
  Claude
  Grok
Grok  Gemini