Monitoring Tools in Enterprise Hosting

Table of Contents
Monitoring tools for enterprise hosting maintain the operational continuity of enterprise websites by tracking, analyzing, and reporting conditions that directly impact service level agreements (SLAs). In the context of enterprise website development, these tools operate as an essential infrastructure layer that underpins hosting reliability, security posture, and regulatory adherence.
Monitoring tools track uptime guarantees, validate performance baselines, and measure SLA metrics such as mean time to detect (MTTD), mean time to respond (MTTR), and acceptable error rate thresholds. For example, 99.99% uptime, MTTD under 15 minutes, MTTR as low as 5 minutes in optimized environments, and error rates under 0.1% are exemplary operational targets in high-performance enterprise hosting.
By integrating with hosting infrastructure, monitoring tools deliver real-time tracking of system performance, automate anomaly detection, trigger alerts that accelerate incident resolution, and reduce operational risk while optimizing resource utilization.
Security monitoring systems for enterprise hosting, including intrusion detection and vulnerability scanning, identify threats before they compromise resources, while compliance monitoring solutions verify ongoing alignment with regulatory frameworks.
Through infrastructure integration and continuous analytics, these tools maintain the reliability, performance, and compliance posture that enterprise website development requires for sustained user trust and contractual SLA adherence.
Service Level Agreements (SLAs)
Service level agreements for website enterprise hosting are the contractual and operational framework that binds monitoring tools to measurable service quality outcomes. They define measurable targets for uptime, incident response, resolution speed, and support availability, making service quality both contractual and trackable.
For instance, an SLA may guarantee 99.99% uptime, require incident acknowledgment within 15 minutes, mandate service restoration in under 2 hours, and provide 24/7/365 support coverage. These targets form the core of enterprise hosting SLA compliance requirements, ensuring that operational performance can be validated against agreed thresholds.
Uptime guarantees commit to a specific operational percentage, with monitoring systems recording and verifying availability and flagging any breach. Response time commitments specify how quickly incidents are acknowledged, with monitoring tools using timestamps from detection to acknowledgment for compliance checks. Resolution timeframes set the maximum period to restore service, tracked and validated through mean time to resolution (MTTR) metrics by monitoring systems.
Support availability windows outline exact coverage periods, such as 24/7, with monitoring confirming and documenting that requests are handled within the agreed window.
Together, these elements create an enforceable framework where SLA compliance monitoring and enforcement metrics in enterprise hosting provide real-time detection, precise timing, and automated reporting. For enterprise websites, strict SLA adherence safeguards revenue, compliance, and brand reputation.
Uptime Guarantee Terms
Uptime guarantee terms in enterprise hosting are quantifiable service commitments, expressed as percentages, that set the minimum acceptable availability of hosted enterprise websites over a specific measurement period, such as monthly or annually. A guarantee of 99.9% availability sets a downtime allowance of roughly 43 minutes per month, while 99.99% narrows this to just a few minutes.
A 100% uptime guarantee, while rare in enterprise hosting SLAs, implies zero allowable downtime and often includes stringent service credit clauses to account for any service interruption. Uptime guarantee figures in enterprise hosting quantify the total time during which a service interruption may occur without breaching the SLA.
Downtime is tracked through availability monitoring tools that continuously measure site accessibility, timestamp outages, and categorize them as planned or unplanned. Planned maintenance windows, outlined in the SLA and executed within the approved maintenance schedule, are excluded from downtime calculations. For unplanned outages, real-time reporting in enterprise hosting captures the exact start and end of each incident, enabling precise downtime calculation.
Uptime guarantee metrics are verified through compliance auditing processes that pull data directly from monitoring systems, producing reports that demonstrate SLA compliance verification. Continuous availability in enterprise hosting tracking serves not only as a technical function but as a business safeguard, since even marginal deviations from the agreed availability threshold can disrupt operations, erode trust, and trigger contractual remedies.
By binding uptime guarantee terms to transparent measurement and verification, enterprises maintain accountability and operational reliability within their hosting agreements.
Response Time Commitments
Response time commitments in enterprise hosting are SLA parameters specifying the maximum time allowed for acknowledging an incident or support request. These commitments are monitored continuously by detection platforms that timestamp and track acknowledgment activity from the moment the incident is logged.
This metric estimates acknowledgment speed rather than the time required to resolve the issue in enterprise hosting. For critical incidents, SLA clauses typically commit to a first-response SLA metric of 5 minutes, while high-priority issues may have a 15-minute threshold, and lower-priority cases a 30-minute target.
Such thresholds are tied directly to monitoring platforms and automated alert systems in enterprise hosting that timestamp and monitor the initial detection, trigger real-time notifications through APIs, monitor system health status, update centralized dashboards, and initiate the escalation protocol if no acknowledgment is recorded within the defined window.
Automated paging and incident routing ensure that the correct escalation tier in enterprise hosting is reached without delay, with each step verified and logged for SLA compliance auditing. By reducing the gap between detection and acknowledgment, response time commitments limit potential downtime impact, maintain contractual uptime guarantees, and sustain operational continuity for enterprise websites.
Resolution Timeframes
Resolution timeframes in enterprise hosting are SLA-mandated limits on how long it may take to resolve an incident fully, measured from initial detection or acknowledgment to confirmed issue closure.
This metric is distinct from response time, which measures how quickly action begins after detection, whereas resolution time measures the total duration to restore service of enterprise hosting. Such closure deadlines vary by incident severity level: critical incidents often require full restoration in ≤2 hours, high-priority issues in ≤6 hours, and medium-priority issues in ≤24 hours.
The restoration window may pause when awaiting customer-dependent actions. Still, every phase of progress is tracked through ticketing systems and incident management tools that log timestamps for both the start and the closure of work. Monitoring dashboards in enterprise hosting feed these platforms with real-time status updates, allowing escalation when targets are at risk.
Verified compliance is documented in audit trails for SLA enforcement, directly tying missed deadlines to breach penalties, potential downtime increases, and disruptions to business continuity. Meeting these resolution targets is essential for safeguarding uptime commitments and sustaining uninterrupted enterprise website operations.
Support Availability Windows
Support availability windows in enterprise hosting are SLA-defined timeframes during which support teams are contractually available to respond to and resolve incidents. These operational hours are defined as contractual obligations within the enterprise hosting SLA, forming a direct basis for response and resolution metrics.
Support availability windows are set as part of the coverage schedule and are aligned with both regional time zones and staffing models to meet contractual obligations. Common coverage models include continuous 24/7/365 operations, business-hour coverage such as 08:00–20:00 on weekdays, and extended-hour schedules like 12×7, with variations often tied to severity level or service tier. Premium support tiers typically guarantee broader coverage hours and faster escalation readiness compared to standard plans.
Coverage commitments are tightly linked to response and resolution targets in the SLA. When an incident is logged, the coverage window determines the clock start for SLA timers and dictates the incident escalation protocol if an incident falls outside standard operational hours. Regional time zone alignment is critical for global enterprises, as misaligned schedules can delay both detection and response, escalating compliance and financial risks.
Support staffing and scheduling verification relies on monitoring systems that log service desk activity, track staffing compliance, and confirm the operational status of communication platforms. These systems collectively verify and monitor that the service desk is staffed and reachable during the contracted periods.
Dashboards in enterprise hosting control panels, integrated ticketing systems, and workforce scheduling software collectively monitor whether the service desk is staffed and reachable during the contracted periods. These logs also provide auditable evidence for SLA performance reviews, ensuring that coverage obligations are met and any deviations are documented for remediation.
SLA Metrics
SLA metrics in enterprise hosting are the quantifiable performance indicators used to measure, verify, and enforce Service Level Agreement compliance. They link uptime, response, and resolution guarantees to the data gathered by enterprise hosting monitoring tools, creating a clear basis for compliance and performance analysis.
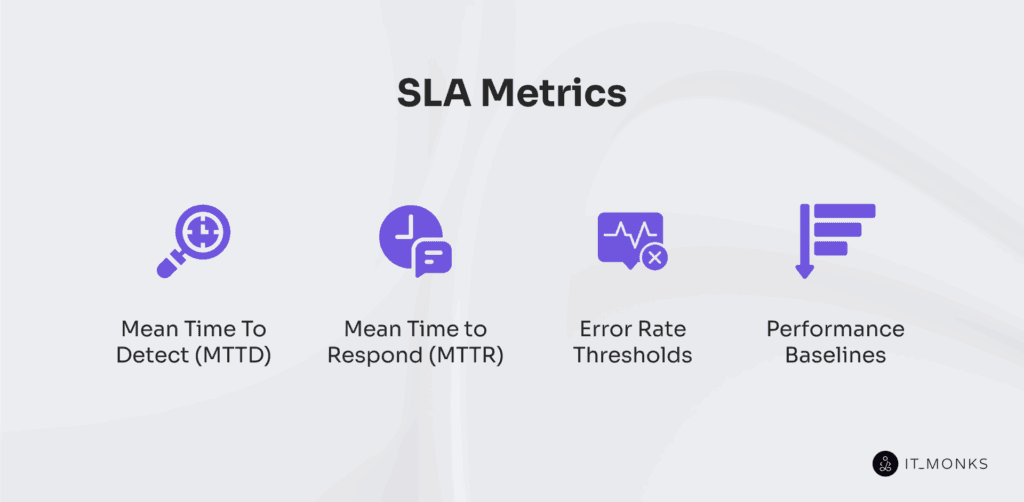
SLA metrics such as MTTD, which measures the detection interval from issue onset to identification; MTTR, which tracks the acknowledgment delay before corrective action; error rate thresholds, which define the acceptable error margin in transactions or requests; and performance baselines, which set a baseline performance benchmark for comparison, form the operational bridge between SLA commitments and real-time monitoring.
For example, an SLA may define MTTD as ≤ 2 minutes, MTTR as ≤ 5 minutes, error rate thresholds as ≤ 0.1 %, and performance baselines as ≥ 500 transactions per second.
The SLA metrics MTTD and MTTR are calculated in minutes from monitoring tool records, error rate thresholds as percentages, and performance baselines in throughput, latency, or similar units.
Monitoring systems collect and analyze these values to identify deviations, confirm SLA compliance, and maintain enterprise website reliability. By aligning each SLA metric with defined compliance thresholds, enterprise hosting teams can verify obligations are met and demonstrate adherence during audits.
Mean Time to Detect (MTTD)
MTTD is the average elapsed time between the start of an incident in enterprise hosting and its detection by monitoring tools or operational teams. MTTD is calculated as the sum of all detection times divided by the number of incidents. It quantifies detection latency, where detection time is logged from the moment the incident starts until an automated alerting platform triggers a detection event, an anomaly detection algorithm flags it, or operational staff identify it.
Measurement units are typically seconds or minutes, with detection timestamp logging tied to the monitoring refresh rate and alert trigger time. A lower MTTD reflects higher detection accuracy and faster movement from incident identification to the response stage.
Real-time monitoring, anomaly detection systems, and well-tuned automated alerts directly influence this value. Broader monitoring coverage across infrastructure layers further reduces blind spots that can inflate detection latency.
For enterprise hosting SLA metrics, typical MTTD targets are ≤2 minutes for critical incidents and ≤5 minutes for high-priority cases, reducing downtime exposure and maintaining business continuity. Consistent MTTD performance serves as a compliance indicator within SLA metrics. It directly impacts the effectiveness of response time commitments by shortening and verifying the operational delay between incident onset and mitigation.
Mean Time to Respond (MTTR)
MTTR in enterprise hosting is the average elapsed time between incident detection and the initiation of corrective action. MTTR is calculated as the sum of all response initiation times divided by the number of incidents, typically expressed in seconds or minutes.
The measurement window begins at the response initiation timestamp recorded by the monitoring system or automated alerting platform and ends when the first remediation step is triggered.
The calculation depends on precise logging of detection events and acknowledgment points. In practice, a shorter response initiation window is achieved through efficient workflow routing, minimal acknowledgment delay, and well-defined incident escalation protocols.
Acknowledgment delay, defined in the incident acknowledgment SLA, directly influences MTTR by affecting how quickly remediation begins. Automated alerting platforms reduce escalation trigger time by delivering incident notifications directly to the appropriate priority response tier. Staffing coverage and alert routing efficiency also influence MTTR, particularly for high-priority or critical severity classifications.
An effective enterprise hosting SLA may define MTTR targets such as ≤5 minutes for critical incidents and ≤15 minutes for high-priority events. These benchmarks guide compliance verification and help maintain uptime commitments by reducing the operational downtime linked to delayed responses.
Accurate MTTR tracking enables SLA compliance verification by providing measurable proof that response targets are met. MTTR is closely connected to other SLA metrics: a low Mean Time to Detect (MTTD) accelerates incident acknowledgment, while alignment with resolution timeframes supports complete service restoration within agreed limits.
Error Rate Thresholds
Error rate thresholds in enterprise hosting are SLA-specified maximum allowable rates of service or transaction failures. Common SLA values are set at or below 0.1% per month, establishing a quantified limit for acceptable service reliability.
They represent a quantified reliability limit, typically expressed as a percentage or ratio of failed requests to total requests. It is calculated as the number of failed requests divided by the total requests and multiplied by 100.
In this context, a failed request may include HTTP 5xx server errors, unsuccessful API calls, dropped database connections, or incomplete transactions. Each error is classified by type and severity so that critical issues, such as service outages, are prioritized over transient or low-impact failures. Measurement periods are defined in the SLA, often on hourly, daily, or monthly bases.
Enterprise hosting providers deploy error logging systems that perform log aggregation and categorize failure data in real time. Monitoring tools calculate the request failure ratio continuously, cross-reference it against the SLA limit, and trigger a threshold breach alert when performance approaches or exceeds the defined boundary.
These alerts initiate escalation workflows that may include automated incident tickets, rapid response dispatch, and compliance auditing procedures.
Exceeding error rate thresholds constitutes SLA breach conditions, leading to contractual penalties, reputational damage, and reduced system stability. Maintaining failure percentages within the defined SLA range is therefore essential to sustaining uptime targets, safeguarding user trust, and meeting regulatory compliance obligations.
Performance Baselines
Performance baselines are SLA-defined benchmark values representing normal, expected operating conditions for enterprise hosting systems. These baselines are established through analysis of historical performance data, alignment with SLA performance benchmarks, and validation via ongoing monitoring.
Each SLA performance benchmark is mapped directly to its corresponding baseline metric to ensure variance detection is precise and enforceable. Every baseline metric represents an agreed reference point, expressed with its specific measurement unit, to quantify normal operating conditions.
A CPU utilization baseline benchmark might be set at 45 percent based on average load during stable operation periods. A network throughput baseline benchmark could be defined at 800 Mbps to represent sustained capacity under expected demand. A load time benchmark, such as 1.2 seconds, captures the average response speed under normal transaction volume. Baseline transaction throughput may be expressed in transactions per second, reflecting the sustained processing rate without performance degradation.
Monitoring systems continuously track and compare live values for each baseline metric, detecting deviations and triggering alerts when thresholds are breached. Deviation thresholds are predefined in the SLA to determine when variance analysis is required.
If CPU usage rises significantly above its benchmark, network throughput drops below the agreed capacity, or load times exceed their baseline, deviation detection systems trigger alerts. These alerts distinguish between minor, short-term fluctuations and material incidents that require SLA-governed remediation actions.
Maintaining accurate and relevant performance baselines supports SLA compliance by providing objective measurement standards. They also inform capacity planning by revealing when resources approach operational limits and guide performance optimization by highlighting persistent deviations from the established operational norm.
Performance Monitoring
Performance monitoring is the continuous, systematic tracking of enterprise hosting infrastructure and application performance against SLA-defined metrics, hosting performance testing metrics, and performance baselines. It operates on a dual front, proactively detecting deviations before they escalate into service disruptions and reactively supplying precise diagnostic data to accelerate remediation when incidents occur.
Operational scope spans from granular metric collection to advanced analysis pipelines. Monitoring systems capture operational telemetry across CPU, memory, disk I/O, and network throughput, refreshing at intervals aligned with the criticality of the resource, often in seconds for high-priority components.
For example, CPU and memory telemetry for mission-critical services may refresh every 1–5 seconds, disk I/O metrics every 30 seconds, and capacity trend reports aggregated weekly, each dataset compared directly against SLA baselines to detect deviations early. Collected data is analyzed through anomaly detection algorithms that compare live conditions against SLA targets, instantly flagging deviations.
The 3 primary focus areas define its function. Real-time performance tracking maintains second-by-second visibility of system health, allowing immediate detection of latency spikes or resource saturation. Resource usage analysis evaluates how computational and storage assets are consumed over time, identifying patterns of over- or under-utilization that can guide reallocation.
Capacity trend analysis projects future demand based on utilization patterns, enabling infrastructure teams to anticipate and prepare for load growth before it breaches capacity thresholds.
Performance monitoring is reinforced by integration with dashboards, API endpoints, and automated alert systems, which centralize data visualization, trigger incident workflows, and maintain direct linkage to SLA compliance verification.
The value extends beyond compliance; consistent monitoring supports optimal resource distribution, sustains uptime targets, and compresses resolution cycles, directly impacting operational reliability and service quality.
Real-time Performance Tracking
Real-time performance tracking is a continuous, instantaneous data collection and analysis of enterprise hosting systems to detect performance deviations the moment they occur. This represents the fastest tier of enterprise performance monitoring, designed to detect deviations the instant they occur.
Real-time performance tracking captures metric streams such as CPU utilization in percentage, memory consumption in gigabytes, disk I/O in operations per second, network throughput in megabits per second, and latency in milliseconds.
Data feeds from servers, network devices, and application layers flow into a threshold alert system, with commonly integrated platforms, such as Prometheus, Datadog, or Zabbix. It handles telemetry ingestion and threshold evaluation at scale, where predefined performance thresholds, set according to SLA baselines for uptime, MTTD, MTTR, and error rates, trigger automated anomaly flags.
Once a performance threshold is breached, processing engines generate instant alerts, often within milliseconds, to integrated monitoring dashboards. These dashboards visualize metric histories, highlight deviations, and initiate automated response workflows, reducing detection timeframes and accelerating resolution.
By aligning refresh intervals, metric coverage, and threshold parameters directly with SLA compliance goals, real-time performance tracking minimizes downtime, improves incident detection accuracy, and maintains operational continuity through immediate remediation triggers.
Resource Usage Analytics
Resource usage analytics are the systematic collection, analysis, and interpretation of enterprise hosting resource consumption data (CPU, memory, storage, bandwidth) to ensure optimal performance and SLA compliance.
CPU utilization metrics are captured in percentage values over defined monitoring intervals, such as 1-minute or 5-minute averages, to detect saturation points or underutilization trends. Memory consumption metrics are tracked in gigabytes to compare actual load against available capacity, highlighting risks of resource exhaustion.
These capacity thresholds are benchmarked against SLA-defined performance baselines to trigger early remediation. Network bandwidth usage is measured in megabits or gigabits per second, with sustained or peak values aggregated and compared against baseline thresholds to identify performance spikes that could signal congestion or security anomalies. Disk I/O performance is monitored in megabytes per second to compare read/write throughput against operational thresholds.
Data from these metrics is aggregated and trended over time, with forecasting models applied to anticipate capacity requirements and align with SLA targets. Visualization layers present utilization thresholds and historical baselines for quick comparison. Utilization thresholds are visually highlighted to distinguish normal patterns from deviations, while anomaly detection flags deviations such as sudden CPU spikes or abnormal bandwidth surges.
These insights feed directly into optimization actions, from workload redistribution to scaling strategies, for example, sustained CPU utilization above 80% over peak business hours or bandwidth usage exceeding 600 Mbps for more than 10 minutes prompts automated scaling actions, reducing the risk of performance degradation and improving long-term capacity planning accuracy.
Capacity Utilization Trends
Capacity utilization trends are the long-term analysis of resource consumption patterns in enterprise hosting environments, used to forecast future demand, prevent bottlenecks, and maintain SLA performance. Trends are predictive indicators that inform scaling decisions and infrastructure investments.
Monitoring tools focus on CPU utilization growth rate, memory load, storage capacity consumption, and bandwidth usage patterns, each measured with precise units such as percentages, gigabytes, terabytes, or megabits per second. Usage data is collected and aggregated daily, weekly, and monthly to reveal growth trajectories, seasonal demand shifts, and recurring usage spikes linked to business cycles or application expansion.
For example, patterns such as a consistent month-over-month increase in CPU load or recurring weekend peaks in bandwidth, like CPU usage increasing by 5% MoM or weekend bandwidth peaking at 950 Mbps, are tracked and analyzed to define the resource planning horizon. By identifying saturation thresholds in advance, these trends act as early-warning indicators for SLA performance risks.
Visualization tools aggregate and visualize these metrics into dashboards and historical reports, highlighting saturation points before they impact performance. This foresight supports scaling forecasts and infrastructure optimization strategies, directly preventing SLA degradation by addressing bottlenecks in advance.
Through this approach, capacity utilization trends align operational stability with cost-efficient growth across the enterprise hosting infrastructure.
Security Monitoring

Security monitoring is the continuous observation, analysis, and alerting of enterprise hosting environments to detect, prevent, and respond to security threats. It focuses on early threat detection, breach prevention, and compliance with defined security standards for enterprise hosting, reducing downtime risks and protecting the integrity of enterprise websites.
Its 3 core pillars are an intrusion detection system (IDS) for threat signatures and intrusion vectors, a vulnerability scanning tool for identifying weaknesses with CVSS-based severity scores, and an anomaly detection algorithm for correlating logs and flagging irregular events.
Each vulnerability is assigned a CVSS-based severity score, and detection workflows track the false positive rate to maintain reliable alerting. IDS targets rapid detection, such as within 10 seconds; vulnerability scans run on set cycles, such as weekly; log anomalies trigger alerts within two minutes. These metrics align with SLA clauses on security event detection timeframes and preventive control cycles.
Monitored data includes network traffic, authentication events, system logs, and vulnerability scan results. Automated alerts and incident escalation link directly to incident management workflows, helping maintain SLA uptime guarantees, meet compliance requirements, and control security risks.
Intrusion Detection Systems
Intrusion detection systems are specialized monitoring tools that identify unauthorized or malicious activity in enterprise hosting environments by inspecting network traffic, system activity, and user behavior. They operate as SLA-critical security tools by influencing how quickly incidents are recognized, how alerts are escalated, and how security compliance is verified.
Network-based IDS (NIDS) scans packet flows across the hosting infrastructure to flag anomalies before they reach endpoints, while host-based IDS (HIDS) monitors logs, processes, and file changes within specific servers.
Detection methods include signature matching against an updated signature database, anomaly detection algorithms that learn normal baselines to flag deviations, and behavioral analytics that correlate patterns across multiple data points.
These methods follow a consistent process: capture network packets or host activity, analyze the data against baselines or signatures, flag anomalies, and generate alerts for escalation.
SLA targets often define detection latency at 10 seconds or less, signature coverage at 99% or higher, and false positive rates under 2%. Mean time to alert is typically measured in seconds, with enterprise SLA clauses often specifying thresholds between 5 and 15 seconds.
Integration with centralized dashboards and automated alert systems ensures SLA measurement points are continuously visible and auditable. By maintaining high signature coverage, minimizing detection delays, and reducing false positives, intrusion detection systems improve threat visibility, shorten the breach window, and support adherence to SLA security clauses and regulatory requirements.
Their integration with real-time dashboards and automated incident workflows ensures that potential compromises are rapidly surfaced, verified, and acted upon.
Vulnerability Scanning
Vulnerability scanning is the systematic, automated process of identifying security flaws in enterprise hosting infrastructure, applications, and configurations. It’s a preventive process of systematically detecting and classifying security flaws across all infrastructure layers, from infrastructure components such as servers, databases, and network devices to application layers, including web applications and APIs.
This control is aligned with regulatory compliance mandates such as ISO 27001, PCI DSS, and HIPAA, ensuring that flaw detection and remediation timelines meet both contractual SLA obligations and statutory requirements.
Scans are executed in both authenticated and unauthenticated modes, and from internal and external vantage points, to capture vulnerabilities that could be missed with a single approach. Each run begins with asset discovery, proceeds through automated flaw detection, applies severity scoring via CVSS, and categorizes results into defined severity tiers.
The findings are compiled into detailed reports for operational teams and compliance auditors. The scan frequency metric is set to align with SLA security maintenance clauses, for example, weekly internal sweeps, monthly external assessments, and a monthly 100% asset coverage requirement. Vulnerabilities with a CVSS score of 7 or higher trigger alerts and initiate patch cycles that must meet defined remediation timeframes, such as resolution within 72 hours.
Coverage rate is continuously tracked, per SLA, as a percentage of the active asset inventory to confirm no host, endpoint, or application falls outside the monitoring scope. The output of each scan feeds directly into patch management workflows and compliance audits against frameworks like ISO 27001, PCI DSS, and HIPAA.
Maintaining this closed loop between detection, prioritization, and remediation reduces the exposure window, supports regulatory conformance, and measurably decreases the likelihood of successful exploitation.
Log Analysis and Anomaly Detection
Log analysis and anomaly detection are the continuous review of system, application, and network logs to identify unusual patterns, behaviors, or security events that may indicate a threat or performance issue. The primary log sources include server logs, application logs, firewall logs, database logs, and authentication logs, each providing distinct event details for centralized log aggregation.
Ingestion pipelines handle sustained high-volume throughput, for example, a 5,000 events/sec log ingestion rate, converting disparate inputs into a unified format enriched with metadata to support event correlation.
Detection thresholds are applied across layered techniques: rule-based matching for known signatures, statistical deviation scoring for baseline shifts, and machine learning classification for complex or evolving anomaly patterns. SLA benchmarks typically require ≤60 seconds detection latency, ≥95% anomaly classification accuracy, and ≤3% false positive rate.
Anomalies exceeding defined deviation scores are immediately flagged and classified by type and severity. They undergo verification to suppress false positives, then integrate with SIEM platforms and trigger automated incident escalation workflows. This closed-loop sequence ensures SLA clauses for security monitoring, uptime protection, and compliance reporting are met, producing measurable outcomes and audit-ready evidence.
By maintaining rapid anomaly identification within SLA-mandated thresholds, the process reduces breach exposure time, safeguards service continuity, and delivers traceable detection records for both regulatory and contractual audits.
Compliance Monitoring
Compliance monitoring is the ongoing verification process ensuring that enterprise hosting operations meet all applicable legal, regulatory, and contractual security requirements. It verifies that operations meet all legal, regulatory, and contractual requirements defined in SLAs. It focuses on two operational pillars: regulatory compliance tracking for laws such as GDPR, HIPAA, or PCI DSS, and security standard conformance checks for frameworks like ISO 27001 or SOC 2.
Audits follow defined cycles, such as annual reviews or quarterly scans, with results measured through compliance scores and recorded non-conformities. For example, a PCI DSS quarterly scan might target a ≥95% compliance score, while GDPR annual reviews could require remediation of non-conformities within 30 days.
Monitoring uses automated scans, scheduled audits, and policy enforcement tools, drawing data from logs, checklists, and verification reports. Findings are validated against certification requirements, with remediation timelines tracked until closure.
While distinct from security monitoring, compliance monitoring integrates with it and with incident management to maintain audit readiness, support SLA compliance verification, and provide measurable proof of adherence to clients and auditors.
Regulatory Compliance Tracking
Regulatory compliance tracking is the structured process of monitoring enterprise hosting operations to ensure continuous adherence to applicable legal and industry regulations, such as GDPR for data protection, HIPAA for healthcare information, PCI DSS for payment card security, and SOC 2 for system controls.
Each regulation is mapped and verified against a regulatory checklist that defines its control points. These control points are verified on an ongoing audit cycle, with each audit frequency metric tied to its applicable regulation, for example, GDPR audits conducted annually, PCI DSS vulnerability scans performed quarterly, or SOC 2 evidence reviews scheduled monthly.
Performance against these checks is expressed in measurable SLA-linked indicators such as compliance score percentages, for instance, achieving ≥98% compliance in PCI DSS quarterly scans, the number of recorded compliance gaps in a non-conformity log, and the remediation schedule for each gap.
A typical remediation timeframe is set in contractual terms, such as completing corrective actions within 14 days of detection. Evidence is stored in an organized repository, including system logs, screenshots, configuration exports, and generated audit reports, each linked to the corresponding regulation’s audit record for traceability and to provide verifiable proof during formal assessments.
Tracking is supported by monitoring tools that automate detection and documentation. Automated compliance scans identify deviations from defined control points, trigger alerts, and generate structured reports that feed into SLA performance dashboards.
This alignment links regulatory compliance tracking results directly to contractual commitments, maintaining certification readiness, reducing audit risk, accelerating gap closure, and sustaining the operational trust expected in enterprise hosting agreements.
Security Standard Conformance Checks
Security standard conformance checks are the process of verifying that enterprise hosting infrastructure, policies, and operational procedures meet the control requirements of recognized security frameworks. Commonly applied baselines include ISO 27001 for information security management, the NIST Cybersecurity Framework, and the CIS Controls, with industry-specific standards added as applicable.
Assessment begins with control mapping, where each requirement from the chosen framework is matched to a corresponding technical safeguard or procedural measure in the hosting environment.
Verification combines automated scans for measurable controls with manual audits for process-driven requirements. Evidence is documented against each control to produce a conformance score, typically expressed as the percentage of applicable controls met. For example, an ISO 27001 assessment might report a 96 % conformance score, with quarterly testing and remediation within 7 days for failed controls.
Testing intervals are defined within the hosting SLA, such as quarterly for critical systems and annually for lower-risk components. Some SLAs stipulate monthly checks for high-change or high-exposure environments. For controls that fail, a remediation cycle is triggered with a defined timeframe, for example, re-testing within 7 days after fixes are applied.
Measured results are incorporated into audit checklists, SLA compliance statements, and, where applicable, certification maintenance records. While regulatory compliance addresses adherence to laws and binding regulations, security standard conformance checks focus on aligning with voluntary but authoritative frameworks that set the bar for security maturity.
Maintaining a high conformance percentage within agreed testing intervals directly supports SLA security compliance verification, strengthens the organization’s audit readiness, and provides clients with demonstrable proof of a controlled and resilient hosting environment. These benchmarks are written into SLA clauses to formalize security performance obligations.
Integration with Hosting Infrastructure
Integration with hosting infrastructure is the technical process of embedding monitoring tools and analytics platforms directly into the enterprise hosting environment to enable seamless data flow, real-time insights, and automated incident response. It connects monitoring API endpoints to these components, creating a data pipeline that transmits SLA metrics without coverage gaps.
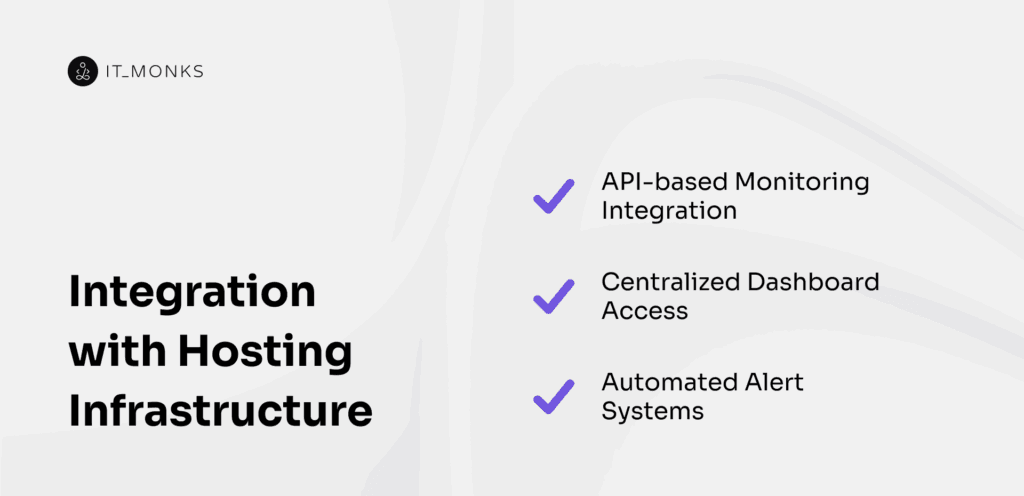
Integration with hosting infrastructure operates through three pillars: API-based monitoring integration, centralized monitoring dashboard access, and automated alerting service linkage. Monitoring API endpoints should maintain latency within ≤200 ms; centralized dashboards should refresh within ≤5 seconds for current SLA views; automated alerting services should deliver notifications within ≤30 seconds of detection.
Each hosting component contributes its own metrics, servers send transaction and error data, databases provide query and uptime stats, storage reports I/O rates, and network devices share bandwidth and latency data.
This integration layer aggregates and correlates this information, synchronizing these diverse data streams into a unified monitoring view, enabling cross-system correlation and eliminating blind spots in SLA metric coverage.
The result is consistent SLA tracking, faster incident resolution, and clear visibility across the hosting environment through synchronized data and immediate response triggers.
API-based Monitoring Integration
API-based monitoring integration is the method of connecting monitoring platforms with enterprise hosting infrastructure through standardized application programming interfaces (APIs) to enable real-time, automated exchange of operational metrics, logs, and alerts.
It links application servers, databases, and network devices to central monitoring systems using defined protocols such as REST, GraphQL, gRPC, or WebSocket, with payloads formatted in JSON or XML. Each request to a monitoring API endpoint carries a payload of current performance values, resource usage statistics, or security event records, which are returned as structured response objects for immediate processing.
Secure exchange is maintained through authentication methods like OAuth 2.0 or API keys, combined with TLS encryption at the transport layer to protect data in transit. Operational benchmarks include API endpoint request latency, often targeted at no more than 150 milliseconds for performance-critical functions, data sync intervals as short as 10 seconds for high-frequency metrics, and supported throughput in the range of dozens of calls per second for large-scale infrastructures.
The integration supports both push and pull models: data can be transmitted at defined polling intervals or pushed instantly when triggered by events. The synchronized flow feeds directly into centralized dashboards for visual performance tracking and into automated alert systems configured to trigger when SLA-related thresholds are met or breached.
This continuous SLA metric synchronization ensures all contractual performance indicators remain current without manual intervention, sustaining compliance for uptime guarantees, performance baselines, and security monitoring commitments. Such a configuration reduces the time to detect and respond to issues, aligning infrastructure operations closely with SLA performance and availability targets.
Centralized Dashboard Access
Centralized dashboard access is the unified interface where enterprise hosting performance, security, and compliance monitoring data are aggregated, visualized, and made accessible to authorized stakeholders. It displays core performance metrics such as CPU utilization, memory consumption, and network bandwidth, alongside SLA compliance indicators, including uptime percentage, MTTD, and MTTR.
The dashboard shows security data types such as security alerts, vulnerability scan results, compliance conformance scores, and capacity utilization trends, which are visualized through formats including KPI tiles, time-series graphs, heat maps, and real-time alert feeds. The data refresh interval is typically measured in seconds or minutes, with historical archives maintained for periods extending up to 24 months.
The dashboard’s data latency metric is designed to remain under 5 seconds to support rapid operational assessment, and concurrent user capacity ensures simultaneous access for multiple operational teams, supporting up to 500 concurrent sessions without performance degradation.
Role-based access control, combined with multi-factor authentication, secures sensitive monitoring views while enabling differentiated permissions by function. Access methods span browser-based portals, mobile applications, and API feeds, providing synchronized data delivery across platforms.
Integration with automated alert systems and SLA reporting modules turns the dashboard into an active control point, accelerating incident detection, sustaining SLA compliance visibility, and streamlining audit preparation through consistent, centralized data presentation. This unified access point enables faster operational decision-making, maintains continuous SLA compliance visibility, and reduces audit preparation time.
Automated Alert Systems
Automated alert systems are the monitoring-integrated mechanisms that instantly notify relevant stakeholders when predefined performance, security, or compliance thresholds are breached in the enterprise hosting environment. This notification process is activated by a threshold breach in monitored parameters, ensuring no deviation goes unnoticed. Automated alert systems monitor critical parameters such as CPU utilization exceeding 85%, latency surpassing 200 milliseconds, intrusion detection events, spikes in failed login attempts, or missed regulatory audit checks.
Once an event trigger is detected, it is evaluated against configured rules, which may rely on static thresholds, dynamic baselines, or anomaly detection models.
This workflow follows a fixed sequence: event detection, rule evaluation, alert dispatch, and delivery confirmation. Approved events initiate a dispatch sequence where alerts are delivered through defined channels, including email, SMS, push notifications, enterprise messaging platforms like Slack or Microsoft Teams, or directly as tickets within IT service management platforms.
Performance of these systems is measured by parameters such as alert generation latency from the moment a qualifying event occurs, commonly within 30 seconds, and delivery success rate, with acknowledgement targets set to defined SLA values, often under two minutes.
Delivery confirmation mechanisms track that each alert reaches its intended recipients, while escalation chains route unacknowledged alerts through higher-priority channels or additional stakeholders. Integration points connect these alert systems to centralized dashboards for visibility, incident management systems for workflow automation, and SLA compliance tools for tracking.
These parameters align directly with SLA clauses on response time and uptime guarantees, providing measurable compliance proof. By reducing mean time to detect and mean time to respond, automated alert systems directly support SLA adherence and minimize the operational and financial impact of service disruptions.
Reporting
Reporting is the structured presentation of enterprise hosting performance, security, and compliance data in formats that support SLA verification, operational reviews, and audit readiness. It draws from real-time monitoring feeds, event logs, SLA metric trackers, and compliance records, transforming them into usable formats such as interactive dashboards, PDF summaries, and CSV exports. This visualization layer ensures performance and security dashboards are clear, actionable, and exportable in multiple formats.
Its core components are SLA reporting dashboards for live service metrics, historical performance audits for trend analysis, and customizable scheduling to control delivery intervals. Data flows from capture through aggregation and formatting to delivery, with benchmarks like dashboard refresh intervals, audit retention periods, and delivery latency targets set for each type.
For example, the SLA reporting dashboard refreshes every 60 seconds, monthly audits are retained for 24 months, and report delivery latency does not exceed five minutes after data capture.
Accuracy rates are tied to source integrity, and access controls separate customer-facing SLA evidence from internal metrics. The data accuracy percentage for SLA dashboards is maintained above 99.9%, verified through automated source integrity checks.
By keeping reporting intervals consistent and archives accessible, this process provides verifiable SLA evidence, aids capacity planning, supports compliance reviews, and accelerates post-incident analysis, strengthening transparency, accountability, and operational oversight in enterprise hosting.
SLA Reporting Dashboards
SLA reporting dashboards are the real-time or near-real-time visual interfaces that display agreed-upon service metrics, enabling stakeholders to verify compliance with contractual SLA terms. Core indicators include the uptime percentage metric, MTTD, mean time to respond, error rate, resource utilization, and incident resolution durations. These SLA KPIs are tracked in real time to verify compliance with contractual terms.
Data updates follow a real-time feed or a 60-second refresh cycle, with display latency kept to five seconds or less from event occurrence. Historical ranges extend to at least 30 days, while dashboard availability is maintained at or above 99.9 %.
Visualization tracks these metrics using KPI tiles for at-a-glance status, trend graphs for performance shifts, gauge meters for threshold tracking, and breach indicators tied directly to SLA clauses. Metric drill-down functions provide granular event timelines and contextual records, supporting direct validation of compliance terms.
This metric analysis ensures that each KPI’s historical and live data can be verified against its corresponding SLA clause. Integration with SLA breach notification systems ensures that threshold violations trigger immediate alerts, linking visual monitoring with rapid operational response.
The result is uninterrupted visibility into contractual performance, faster identification of deviations, and reinforced trust between service provider and client.
Historical Performance Audits
Historical performance audits in enterprise hosting are the structured review of past operational data to verify SLA compliance over defined periods, identify performance trends, and provide evidence for dispute resolution or compliance checks. The process covers uptime history records, incident resolution timelines, error rate trends, and resource utilization patterns.
These datasets are retained under an audit data retention policy, often spanning 12 to 36 months to support compliance verification, SLA dispute resolution, and long-term trend analysis, stored in structured databases or secure compliance archives.
Data accuracy rate is maintained at or above defined thresholds, typically ≥99%, with retrieval latency measured in seconds, commonly ≤60 seconds, to support timely analysis. Audit completion timeframes typically range from X to Y days, depending on dataset volume and verification scope.
Validation is carried out by correlating archived metrics with active monitoring system outputs, cross-referencing incident logs with ticketing platforms, and verifying values against the SLA’s metric definitions. A completed audit documents verified performance baselines and deviations, documenting compliance archives ready for regulatory checks.
This historical record serves as evidence during SLA renewal negotiations, supports resolution in performance disputes, and informs performance improvement initiatives through trend analysis. By retaining verifiable, high-integrity data with controlled retrieval times, these audits function as both contractual safeguards and operational optimization instruments.
Customizable Report Scheduling
Customizable report scheduling is the capability for enterprise hosting clients and administrators to set the frequency, timing, and format of automated performance, security, and compliance reports. Scheduling intervals include fixed cycles such as hourly, daily, weekly, or monthly, along with event-triggered delivery after defined conditions like an SLA breach or completion of scheduled maintenance.
In addition to recurring and event-triggered runs, on-demand generation ensures reports can be produced instantly when unplanned reviews or urgent audits arise. Each scheduled output can be produced in multiple report format types, including PDF for static review, CSV or Excel for structured data processing, and interactive dashboard links for real-time exploration. Delivery channels range from secure email and dashboard downloads to API-based pushes for integration with external systems.
Report generation latency is a measurable benchmark, with targets set so that reports are generated and dispatched within 5 minutes of a reporting period’s close. Delivery success rate is maintained at or above 99.9% to meet SLA reliability expectations, and scheduling granularity defines the minimum allowable interval between automated runs.
Security controls extend to delivery channel security measures, including encryption protocols that protect the transmitted files in transit and at rest, while role-based access governs who can configure or modify schedules to preserve data integrity.
Each schedule configuration has its specific parameters, including output formats (PDF, CSV, Excel, interactive dashboard link), delivery channels (secure email, dashboard download, API push), ≤5 minutes latency, ≥99.9% delivery rate, and scheduling granularity with a minimum interval allowed of 15 minutes.
By aligning scheduling interval type, output format, and delivery method with SLA metrics, customizable report scheduling supports proactive compliance tracking, keeps capacity and resource planning on a predictable cycle, and guarantees that audit-ready evidence is available without manual intervention. This combination reduces operational overhead while keeping verified historical and real-time insights consistently available to authorized stakeholders.


Contact
Don't like forms?
Shoot us an email at [email protected]