Performance Testing for Enterprise Hosting

Table of Contents
Performance testing for enterprise hosting is applied to validate enterprise website scalability and uptime under expected and extreme operational loads. The testing process validates infrastructure resilience by measuring concurrency handling, time-to-first-byte (ms), throughput (Mbps or req/sec), and page load latency. It functions as a core validation layer within enterprise website development, targeting system behavior during real-time operations.
An enterprise website depends on high uptime, scalable resource allocation, and consistent load handling across distributed hosting tiers. To meet these operational demands, performance testing simulates production-level conditions across backend systems and deployment tiers. Hosting performance testing supports these functions by simulating operational loads in time-based test cycles that stress CPU, memory, I/O, and network capacity.
Each test cycle identifies response thresholds, highlights failure points, and monitors for resource exhaustion under controlled pressure. Thresholds may include latency above 500ms, throughput drops below 100 Mbps, or memory usage exceeding 80% during spike conditions.
Performance testing is a structured validation step embedded in the hosting lifecycle. Its testing exposes infrastructure limitations, confirms SLA compliance, and informs decisions on load balancing, caching, and content delivery strategies. Without this layer, enterprise web deployments risk unseen bottlenecks, degraded speed under scale, and unpredictable downtime.
Purpose of Performance Testing
Performance testing for enterprise hosting validates whether an enterprise website’s infrastructure can operate reliably under expected system loads. It quantifies how backend components, servers, storage, containers, and orchestration layers respond to concurrency levels, resource limits, and latency ceilings by measuring thresholds such as CPU usage (%), memory limits (MB/GB), and latency ceilings (ms) before deployment.
This testing is a precondition for operational assurance in environments where failure carries SLA penalties, degraded user experience, or unscalable growth patterns.
Such validations derive from simulation frameworks tuned to reflect production-scale user behavior, concurrency loads, and network latency patterns.
By simulating real-world access through test harnesses and structured load profiles, hosting performance testing verifies latency thresholds (e.g., below 250ms at 95th percentile concurrency) and resource scaling behavior against predefined CPU and memory thresholds under pressure. It monitors for failure risks tied to CPU saturation, memory exhaustion, and I/O delays, conditions that emerge only under stress.
These metrics offer exact values: throughput in requests per second, latency ceilings in milliseconds, and resource thresholds measured against infrastructure limits.
Enterprise websites depend on hosting setups that are often complex and brittle. Without performance testing, container clusters, network edges, and storage backplanes become silent bottlenecks, often surfacing as throughput drops below expected Mbps levels or rising latency beyond SLA-defined ceilings. Performance testing exposes these early, detecting where response times spike or throughput collapses, before deployment introduces real users into unstable environments.
This testing simulates concurrency surges and load fluctuations to detect infrastructure limitations, such as degraded response rates at 80% CPU usage or memory thrashing beyond 4GB usage thresholds. It validates whether system uptime remains intact when access patterns shift, and whether autoscaling triggers efficiently within defined thresholds. These verifications feed directly into deployment planning and resource allocation.
For enterprise website development, hosting performance testing establishes baseline performance thresholds that the infrastructure must meet. It quantifies the conditions under which availability holds or fails, making it an integral layer of risk mitigation. Rather than treating load behavior as guesswork, it maps enterprise hosting stability to defined, testable metrics, closing the gap between projected capacity and operational reality.
Ensuring High Availability
High availability through performance testing allows enterprise hosting environments to maintain system uptime across failure events, load surges, and regional disruptions. These availability outcomes are essential for enterprise websites that rely on uninterrupted access to serve users and meet business continuity requirements.
Performance testing cycles validate availability targets, such as 99.99% uptime SLAs, by simulating node failures, load balancer reroutes, and redundancy loss under production-like traffic.
These tests measure recovery time objectives (RTO), health check accuracy, and failover routing speed across distributed zones. Metrics such as sub-60-second failover and uninterrupted session continuity are measured to confirm HA readiness thresholds defined in enterprise SLAs.
Redundancy layers, clustered failover systems, and heartbeat monitors are subjected to controlled outages to confirm their behavior under stress. Such tests span redundancy zones across multi-region deployments, exposing real-world HA behavior under distributed failure conditions.
Performance testing in this context exposes whether the hosting environment can uphold service continuity across its full deployment topology. This confirms that the enterprise hosting infrastructure sustains website accessibility under infrastructure instability.
Validating Load Resilience
Validating load resilience allows enterprise hosting environments to maintain stable behavior under fluctuating demand. In enterprise hosting environments, load resilience refers to the system’s ability to sustain expected performance, consistent response times, uptime, and throughput under realistic or extreme load conditions, such as traffic spikes, high concurrency, or backend saturation. This attribute is verified through structured hosting performance testing.
Performance testing simulates user activity at scale using load generation tools and traffic models. These simulations are orchestrated through test agents and controllers that model real-world session concurrency, targeting specific throughput ceilings and request queue thresholds.
Enterprise hosting stacks are validated for load resilience through structured testing scenarios that push known performance thresholds under stress. A resilient system, for example, should maintain 400ms response times with 500 concurrent sessions over 30 minutes, without timeout errors or performance degradation.
Tests such as step-load, ramp-up, spike, and soak are used to model dynamic traffic behavior and verify system elasticity and endurance over time. Metrics like queue depth, CPU load, and latency under load are tracked to identify when the system crosses into failure risk zones. For example, during a 25-minute test at 800 concurrent sessions, if latency stays under 350ms with no CPU saturation or queue overflows, system resilience is confirmed.
By modeling throughput tolerance and observing degradation curves, such as response delay increase beyond the 10,000 req/min throughput ceiling, performance testing quantifies system durability under resource saturation. This confirms whether enterprise websites can scale reliably by retaining elasticity under pressure, supporting key functions like real-time dashboards or high-traffic portals without interruption.
Detecting System Bottlenecks
Performance testing detects system bottlenecks by exposing resource constraints that inhibit throughput, inflate latency, or degrade enterprise website operations under load. A system bottleneck, in technical terms, is a saturated resource or constrained process, such as CPU utilization exceeding 92%, memory allocation under heap pressure, disk I/O plateauing at 9,000 IOPS, thread pool saturation at 80%, or query execution delays surpassing 1.2 seconds, that limits the system’s capacity to process concurrent demands.
These points, when unaddressed, become critical failure vectors in high-demand enterprise hosting environments.
Structured hosting performance testing isolates these constraints by simulating real-world load conditions across the hosting stack. Using test instrumentation such as load generators, synthetic traffic, and monitoring agents, the infrastructure is profiled under variable load intensities.
Such tools capture metrics such as CPU saturation at 93%, IOPS ceiling at 9,000, or query latency increase from 200ms to 1.4s under concurrent load. This diagnostic suite collects latency metrics, throughput behavior, error rates, and queue depths across system layers, allowing testers to pinpoint saturation thresholds and failure onset zones. For example, when CPU usage remains above 92% for sustained durations, thread starvation can emerge, causing response time inflation beyond SLA thresholds.
Enterprise websites, due to the concurrency levels, dynamic content rendering, and backend integration complexity, are acutely vulnerable to resource saturation that remains invisible during routine operations. Performance testing exposes these latent constraints by triggering resource strain through load-induced telemetry capture.
A seemingly minor I/O ceiling at 9,000 IOPS might cause a 23% throughput drop under load spikes. Or, query performance degradation from 200ms to 1.4s under a 300-user concurrent load reveals database inefficiencies not evident during normal traffic periods. These performance artifacts surface only through precision testing sequences that monitor degradation patterns over time.
Key attributes of bottleneck detection include time-based saturation profiling, telemetry correlation, and root cause isolation across infrastructure domains. Metrics like thread queue depth (e.g., reaching 80% max active threads during peak hours), garbage collection delay (e.g., GC pause >500ms under heap pressure), or network interface congestion (e.g., latency spikes over 150ms during 85% throughput utilization) serve as actionable indicators. These attribute-value pairs, logged across test cycles, anchor the root cause analysis that leads to targeted remediation.
Bottleneck detection through testing enables architectural tuning, such as adjusting thread pool sizes, refactoring database access layers, introducing caching tiers, or segmenting traffic across load-balanced clusters. These optimizations stem directly from telemetry-led profiling that maps system strain to its architectural root.
Beyond optimization, this detection process supports SLA conformance, cost-efficient scaling, and resilient service delivery. Without performance profiling to isolate and quantify these constraints, enterprise websites risk structural inefficiency and operational exposure during high-load events.
Types of Performance Tests

Performance testing in enterprise hosting is classified into 4 distinct test types, each designed to simulate specific usage conditions and evaluate targeted system behaviors. In enterprise hosting environments, these test categories function as targeted validation layers, each replicating unique system states to measure infrastructure resilience.
The 4 primary types, load testing, stress testing, soak testing, and spike testing, differ by objective, duration, and the conditions they replicate.
Load testing simulates gradual concurrency escalation to evaluate system throughput and response stability during workload growth. It measures system behavior as user volume increases, identifying how infrastructure performs under rising, yet expected, load levels.
Stress testing targets resource exhaustion by pushing systems beyond their operational capacity to reveal failure points and measure performance under saturation. This test identifies how systems degrade when critical limits are exceeded, exposing resilience gaps.
Soak testing validates infrastructure endurance through duration-based simulations that reveal long-term performance degradation, memory leaks, and queue accumulation under sustained load. It is designed to detect failures that only emerge during prolonged system use.
Spike testing simulates burst events to evaluate infrastructure volatility and recovery metrics during sudden traffic surges. It assesses how well systems handle abrupt load fluctuations and how quickly they return to stable operation.
Together, these test types replicate production-grade traffic scenarios in controlled conditions, each exposing distinct infrastructure limits, whether tied to concurrency thresholds, resource fatigue, or burst tolerance. In enterprise hosting, test selection is context-driven validation that safeguards uptime, scales SLA commitments, and ensures system resilience across all operational phases.
Load Testing
Load testing is a controlled performance testing method used to validate how enterprise hosting systems behave under expected traffic conditions. It measures how an enterprise hosting environment performs under expected user load.
Load testing simulates realistic concurrency conditions to validate whether the system can sustain stable performance within projected usage thresholds. The objective is to measure and confirm operational stability, not to find the failure point. That distinction belongs to stress testing.
In practice, load testing applies simulated traffic patterns that reflect real-world usage scenarios within concurrency thresholds, including session generation, API interactions, database operations, and static file access.
These scenarios operate within a defined concurrency threshold, such as 500 to 1,000 simultaneous sessions, depending on the anticipated demand. Each load test suite is configured to simulate known workload characteristics tied to enterprise SLA obligations.
For enterprise hosting, load testing plays a central role in SLA alignment. It verifies whether infrastructure components can deliver agreed response times, uptime levels, and throughput targets under sustained load.
This includes collecting and analyzing TTFB(Time to First Byte), page load duration, average request throughput (e.g., requests per second), error rates, and system resource consumption, especially CPU and memory usage. These outputs are the performance baseline used to guide capacity planning and identify weaknesses before go-live.
An enterprise-grade load test defines operational truth. Baselining establishes expected behavior ranges tied to specific system configurations, enabling accurate detection of future regressions. Without this benchmark, any future infrastructure change becomes guesswork. Only a consistent reference point reveals degradation or improvement.
Ultimately, load testing validates performance predictability. It confirms whether enterprise hosting can meet demand with stability, not whether it can survive chaos.
Stress Testing
Stress testing is a performance testing methodology used to identify the upper operational boundaries of an enterprise hosting environment. It deliberately exceeds system capacity to evaluate failure tolerance and recovery behavior. Stress testing forces the enterprise hosting environment past its design thresholds to expose failure conditions and capture system breakdown signatures, what breaks, when it breaks, and how the infrastructure responds.
Unlike load testing, which operates within expected usage thresholds, stress testing simulates abnormal pressure: traffic surges, excessive concurrency, and inflated data input rates. Stress testing triggers these conditions to expose failure points like CPU exhaustion, memory leaks, thread pool starvation, timeout cascades, unresponsive services, and system crashes.
The test captures system behavior at the saturation point, logs error bursts, and monitors degradation curves across critical services. During the test, error propagation is recorded via threshold-based alerts, resource graphs, and crash logs to provide an empirical failure blueprint. Stress testing also evaluates the activation and sequence of failover protocols under stress-induced failures.
The goal is to pinpoint structural weaknesses and understand post-failure behavior, including system downtime, recovery time, queue clearing efficiency, and restart script execution. Recovery mechanisms are evaluated through RTO (Recovery Time Objective) tracking and crash analytics.
In enterprise hosting, where uptime directly supports mission-critical operations, stress testing is vital. It translates failure events into actionable metrics and aligns infrastructure resilience with real-world tolerance limits. The insights from stress testing feed directly into capacity planning and infrastructure fortification, giving teams real-world data for architectural decisions.
Soak Testing
Soak testing is a performance testing method designed to evaluate the long-term durability and consistency of enterprise hosting systems under sustained load. It evaluates system behavior under sustained load applied continuously for several hours or even days.
Such testing simulates realistic, steady-state traffic to observe whether the system quietly degrades over time. The focus is on validating long-term reliability, not peak performance.
By maintaining expected traffic patterns over an extended test runtime, soak testing monitors how well enterprise hosting systems preserve operational stability. It tracks metrics like memory growth, CPU usage baseline, queue length, disk I/O consistency, and latency drift. Soak testing detects gradual performance degradation patterns such as memory leaks, session bloat, logging overhead, and thread exhaustion by monitoring these resource trends over time.
This helps uncover issues like garbage collection failure, thread locking under minimal variation, or container crash loops, problems that emerge only after prolonged operation.
Enterprise platforms with continuous uptime demands, like internal dashboards or client portals, rely on soak testing to confirm durability over time. This includes monitoring for infrastructure fatigue, such as container crash loops or garbage collection failures, that manifest only under prolonged usage.
Unlike stress or spike tests that simulate sudden impact, soak testing simulates long-term exposure to validate system stability under continuous operation.
Spike Testing
Spike testing is a performance testing technique used to evaluate an enterprise hosting environment’s response to sudden, extreme traffic surges. It triggers abrupt traffic surges to observe how enterprise hosting systems absorb shock and initiate recovery mechanisms.
This testing simulates sudden user floods, such as a jump from 50 to 5,000 sessions in seconds, to trigger sharp resource demand and capture metrics such as auto-scaling latency, service degradation, or query queuing under stress.
Unlike load testing’s gradual rise or stress testing’s prolonged overload, spike testing focuses on shock. It captures metrics like latency escalation, burst-time failure rates, and time to recovery. Spike testing monitors hosting environments for auto-scaling initiation delays, service lag time, request queue spikes, and rate-limiting triggers.
These tests reveal how quickly systems react, whether they crash, throttle, or scale. For example, a spike might expose a 14-second delay before container scale-up or a database latency rise from 210ms to over 900ms.
Spike testing is critical during unpredictable surges from product launches, media coverage, or login floods. It validates the elasticity and scale rules of cloud infrastructure under real-world volatility. Tools such as Gatling, JMeter, or Locust are used to simulate burst thresholds and log system response metrics with millisecond precision.
Without spike testing, enterprise websites face undetected scalability gaps and delayed recovery during mission-critical load spikes.
Performance Testing Metrics
Performance testing metrics provide quantifiable insight into how enterprise hosting systems respond under load. They are extracted test outputs that track latency, responsiveness, and throughput at defined measurement intervals across simulated test phases.
Such values are essential for identifying infrastructure strain, confirming SLA targets, and planning for scale. Performance testing metrics also reveal system bottlenecks and enable metric-driven optimization for hosting environments under variable stress.
Collected during structured load, stress, and spike tests, these metrics expose behavioral patterns under simulated operational stress. Each output reflects a specific part of the hosting stack, from server-side readiness to user-facing delivery time. Together, they form a performance baseline for detecting slowdowns, tuning resources, and benchmarking improvements.
TTFB measures server response time captured during initial request handling. It focuses on backend responsiveness before any page content is delivered. This metric connects test data to backend health and load-readiness diagnostics.
Page load time captures full page render time from request to visual completion. It covers the complete delivery chain: server, CDN, scripts, and browser processing. It reflects end-to-end latency, not just server speed. Page Load Time bridges system-side throughput with user experience thresholds under test conditions.
Throughput under load quantifies the request handling rate under concurrent sessions. It shows whether hosting resources sustain performance or degrade as traffic climbs. Throughput under load is used to benchmark capacity and forecast scaling needs. High throughput with stable response curves indicates infrastructure resilience during peak load events.
Each metric connects a system event to a measurable output. Without these metrics, testing lacks actionable data for SLA validation and infrastructure tuning. Performance metrics form the evidence layer for enterprise website reliability forecasting and optimization roadmapping. Performance must be proven through data, measured, compared, and acted on.
Time to First Byte
Time to first byte is a low-level latency metric used to measure the elapsed time between a client initiating a request and receiving the first byte of response from the server. It measures the time between request initiation and the first response byte received from the server.
TTFB reflects backend responsiveness before content delivery begins, isolating the latency introduced in the early stages of the request-response cycle. In enterprise website hosting, time to first byte functions as an early signal of backend system health, directly capturing response latency introduced by server processing delays, network routing inefficiencies, middleware queues, or I/O bottlenecks under load.
TTFB profiles multiple latency segments that span the technical request chain. It includes DNS resolution time, TCP handshake delay, SSL negotiation latency (if HTTPS is active), server processing duration, and response initiation lag. These collectively determine the backend delay experienced before the browser receives any part of the payload. This makes TTFB particularly suited for low-level latency diagnostics in enterprise performance testing pipelines.
When subjected to performance testing simulations, specifically load, spike, and stress tests, TTFB metrics surface critical latency patterns. For instance, a rise in TTFB under concurrent session spikes often signals thread pool saturation or CPU contention.
During stress phases, memory exhaustion or I/O locks tend to inflate server processing time, which inflates TTFB beyond operational thresholds. In spike conditions, erratic response initiation latencies across API gateways or CDN edges expose asynchronous queuing delays and routing misalignments.
Each performance test phase, load, spike, or stress, generates distinct TTFB variance patterns, allowing engineers to map delay anomalies to specific stack components.
These latency fluctuations often precede more visible failures in content rendering or full page load metrics, making TTFB a preemptive metric for backend health degradation. Asynchronous pipeline blocks, excessive synchronous dependencies, and overworked cache layers typically first register as TTFB inflation.
Percentile-based breakdowns of TTFB expose high-risk latency zones in enterprise load profiles, especially when the 99th percentile surpasses operational thresholds despite stable medians. A median of 230ms might coexist with a 99th percentile of 920ms during backend load accumulation, highlighting edge-case bottlenecks invisible in aggregate metrics.
TTFB also reflects the effectiveness of infrastructure tuning. Adjustments in server-side caching, connection pooling, or origin distribution should yield observable reductions in TTFB variance. Conversely, persistent elevation of this metric post-optimization usually flags unresolved queuing logic or saturation in the compute layer.
In enterprise environments, TTFB validates the capacity of the hosting stack to sustain backend throughput under load. It serves as a foundational benchmark to expose application-layer congestion before downstream performance is affected. This latency metric profiles backend behavior under duress, acting as a sentinel for responsiveness, throughput ceilings, and pre-failure system dynamics.
It also underpins SLA validation, acting as a quantifiable signal for meeting backend response guarantees under varying concurrency levels.
Page Load Time
Page load time is the total duration between request initiation and full page rendering in the client browser, including all network, server, and client-side processing steps. It represents the total time it takes for a web page to become fully interactive after a user request. Page Load Time is a composite metric that accumulates delays across the server, network, and client-side processes. This includes TTFB, HTML parsing, asset downloads (CSS, JS, images), JavaScript execution, and full DOM rendering until post-load event handlers complete.
This progression culminates in the DOMContentLoaded event, signaling DOM readiness before interactive readiness completes. Each of these phases exposes a different layer of system performance, and together they surface the load behavior under different hosting conditions.
Such a metric directly reflects backend-to-frontend handoff efficiency, spanning server response, CDN throughput, and client render sequencing, and shows how well the infrastructure handles concurrent demands.
TTFB captures server responsiveness; HTML parsing and JavaScript execution expose the render-critical path and blocking script delay; asset load sequencing stresses the distribution strategy, particularly under CDN edge or origin-based fetch conditions. These phases can be further fragmented by cache state (cold vs warm), which significantly alters how fast a page transitions to a fully loaded state.
Enterprise hosting performance testing measures Page Load Time across a matrix of conditions: concurrency levels, cache warmth, CDN coverage, and regional test origins. During load tests, increased request queues amplify backend latency; under soak tests, memory and CPU contention influence execution delays. Geographically distributed load points uncover CDN edge latency, while spike testing reveals sensitivity to asset bloat or inefficient client-side rendering.
The metric is especially critical in enterprise hosting environments, where user-perceived latency has direct implications on conversion, SEO rankings, and SLA compliance. For example, if a homepage exhibits a 4.8s 95th percentile load time under CDN edge offloading with server-side rendering enabled, the delay surfaces not just server constraints but frontend inefficiencies.
Similarly, a 3.2s Page Load Time observed under 800 concurrent sessions with full asset downloads reveals both infrastructure resilience and frontend delivery complexity. Conversely, a sub-2s Page Load Time can be achieved through optimized hosting tiers, warm cache states, and full CDN edge coverage.
Page Load Time varies with page weight, the number and size of third-party scripts, and the layering of lazy load strategies. Paint metrics such as First Paint and Largest Contentful Paint serve as intermediate markers within the load timeline, highlighting when key visual elements become visible before full interactivity is reached.
It is shaped by render-phase delays (e.g., JavaScript blocking), execution time (e.g., synchronous reflows), and critical paint timings. Though often treated as a surface metric, page load time functions as a diagnostic aggregate; its subcomponents trace performance bottlenecks across the full request-response lifecycle. In essence, it reveals how infrastructure, CDN configuration, client rendering, and content complexity converge to define enterprise website responsiveness under real-world load.
Throughput Under Load
Throughput under load is a key performance metric that measures the volume of successful requests processed by the enterprise hosting system per unit of time, typically during simulated high-concurrency conditions.
This load calculates how many successful requests an enterprise hosting system processes per second during performance testing. Throughput is typically measured in requests per second (RPS), transactions per second (TPS), or data volume per second, depending on the system and test configuration.
Such a metric, tracked during load, stress, soak, and spike testing scenarios, reveals system behavior as concurrency increases: rising throughput, then a plateau at the saturation point, followed by a drop when resources are overwhelmed. This curve shows where the infrastructure hits its limits.
The throughput plateau, flatlining delivery despite rising concurrency, marks the system’s maximum sustainable output. A sharp decline marks failure thresholds, often tied to CPU, memory, or I/O exhaustion. This throughput degradation helps identify infrastructure strain points and architectural weak spots.
Throughput under load identifies scaling elasticity: if additional nodes raise throughput, the infrastructure supports horizontal expansion. If not, the bottleneck lies deeper, in architecture, services, or resource distribution. This metric validates SLA throughput targets by confirming whether the system can sustain agreed request volumes during peak test intervals.
Stable throughput across extended test interval windows signals production-readiness and resilience under continuous concurrency. Fluctuating delivery rates during sustained tests may indicate hidden bottlenecks or inconsistent load handling across tiers.
Only successful responses count. Error-adjusted throughput filters out failed attempts to offer a cleaner picture of system efficiency. This reflects the successful transaction ratio, not just total traffic attempts. High RPS with low error rates is the benchmark for enterprise-grade hosting performance.
In short, throughput under load profiles real-world delivery capacity: it measures success under concurrency, reveals system bottlenecks, validates scalability assumptions, and confirms whether the hosting infrastructure can meet contractual performance expectations under pressure.
Enterprise Hosting Setup
The enterprise web hosting setup defines the infrastructure on which all performance testing is conducted. It structures system resources into separate tiers, each with specific roles, limits, and performance behavior under load. These tiers shape how an enterprise website responds to concurrency, scales under demand, and recovers from stress.
The stack begins with the front-end delivery layer: web servers and load balancers handle incoming requests and distribute traffic. Load balancers trigger horizontal scaling policies or queue excess sessions when thresholds are reached.
Below that, the application layer consists of containerized runtime instances managed by orchestration platforms like Kubernetes, governed by autoscaling policies based on CPU/memory thresholds. Each instance is provisioned with defined CPU and memory limits (e.g., 4 vCPUs, 16GB RAM), and scaling is capped by the node pool size.
Logging and monitoring infrastructure, such as Prometheus and the ELK stack, track tier behavior under load, exposing metrics like response time spikes, CPU throttling, and failed scaling attempts.
The database and storage layer manage data read/write operations with defined IOPS ceilings and storage types (e.g., SSD, NVMe). Replication and failover rules influence how quickly the system recovers from DB-level stress. A caching and CDN layer handles static asset delivery and offloads repeated requests, reducing backend hits and improving TTFB under concurrent access, especially when the cache hit ratio exceeds 85% and edge locations serve >90% of static assets.
All of this runs within a set of provisioning constraints. Bandwidth may be capped at 1Gbps with burst support to 10Gbps. CPU, RAM, and disk I/O are isolated per container or VM, but tier ceilings limit how far vertical or horizontal scaling can go.
For example, a container cluster might auto-scale to 10 nodes, but no further, as horizontal scaling is capped by provisioning policies set at the orchestration level, causing load tests beyond that point to trigger latency increases or dropped sessions.
Hosting service tiers impact isolation and performance predictability. Shared environments introduce resource contention. VPS adds partial isolation but caps vertical scaling. Dedicated servers remove contention but remain static. Container-based cloud hosting supports autoscaling but adds cold start latency and scaling delay, which show up clearly in spike testing. These delays directly affect spike recovery time, as containers may take several seconds to initialize under burst load, causing temporary drops in availability.
This hosting structure affects test metrics directly. TTFB is tied to front-end load handling and CDN cache hits. Throughput caps stem from network and CPU ceilings. Page load consistency is affected by database I/O and memory pressure. Load balancing success depends on how quickly horizontal scaling reacts and whether service limits block further expansion.
Performance testing outcomes only make sense when mapped to the configuration behind them. The hosting setup isn’t just where the site runs; it’s what defines how far and how fast it can respond under pressure. The tiered structure dictates how much load each layer tolerates before degradation begins, revealing the true concurrency limits of the enterprise stack.
Hosting Tier Influence
The hosting tier determines how resources are provisioned and shared, directly influencing enterprise website performance under test conditions. Each tier imposes distinct constraints on compute availability, memory isolation, network handling, and scaling response, all of which directly modify test results through isolation boundaries and resource handling behavior.
Shared hosting tiers operate on fixed, multi-tenant setups where CPU and I/O are arbitrated. Under concurrent traffic, resource contention leads to unstable TTFB and early error spikes.
VPS tiers partition resources more cleanly but still suffer from noisy neighbor effects. Throughput is constrained by soft boundaries and shared hypervisors, often plateauing early under concurrent sessions.
Dedicated hosting removes virtualization overhead, providing consistent CPU and RAM access. Tests on dedicated machines show stable load recovery and reduced latency variance.
Containerized tiers provide elastic scaling but delay responsiveness due to container orchestration overhead. Metrics skew slightly during autoscaling windows, where resource adjustment lags behind demand.
Cloud-native PaaS tiers (e.g., EC2 classes) vary widely. Lower-tier instance classes throttle under sustained load, introducing test result skew and undermining repeatability. Higher-tier instances offer predictable scaling and cleaner metric lines.
Bare-metal environments produce the most reliable data, where performance correlates directly with hardware saturation.
Different tiers mean different ceilings. Identical load profiles yield different results across tiers because of the infrastructure class. Without factoring in the tier, test results lose meaning.
The hosting tier dictates the scaling response, test ceiling, and interpretive baseline for all performance metrics.
Resource Scaling Limits
Resource scaling limits the upper boundaries of computational, memory, storage, and network resources that an enterprise hosting environment can dynamically allocate under load. It caps the maximum capacity a hosting system can reach through vertical or horizontal expansion under load.
In enterprise environments, this boundary defines where performance stops adapting and starts breaking. Every tier, from cloud to container to dedicated, has thresholds that fail to maintain throughput under pressure.
Vertical scaling adds CPU, memory, or I/O within existing nodes. This path encounters hard ceilings fast: vCPU allocation caps, memory ceilings like 32GB per instance, or IOPS throttling at the storage layer.
These are enforced limits; even before hardware is maxed, soft quotas and provider policies can block further allocation. Under load, this means systems saturate without improving throughput, no matter how much demand rises.
Horizontal scaling distributes traffic across more nodes or containers. But this expansion isn’t immediate. Auto-scaling has lag, cold start delays as new instances spin up, often missing the demand spike. Kubernetes environments might limit pod counts or suffer from orchestration bottlenecks.
Even with elastic infrastructure, quota ceilings or misconfigurations stall expansion. Bandwidth throttles and container limits cap concurrent throughput, often exposing latent constraints only during stress testing.
For example, a Kubernetes cluster with a max pod count of 60 and a scale-out delay of 22 seconds failed to meet demand under 1,200 concurrent sessions, stalling at 3,200 RPS.
These ceilings leave clear signatures during testing: flatlined throughput, rising error rates, and delayed responses. Spike and stress tests often reveal scale-out delays, where demand overwhelms capacity before expansion starts. Soak tests expose long-term limits, like memory leaks that erode performance over time. These are fixed behaviors of infrastructure under pressure.
Triggers for scaling, reactive, predictive, or manual, dictate whether performance degrades briefly or collapses entirely. The delay between saturation and scaling response is often what determines failure severity. This delay window becomes a defining input in SLA modeling, directly affecting uptime guarantees and load resilience planning.
Some environments monitor thresholds poorly or not at all. When limits are hidden, tests become the only source of truth.
Resource scaling limits define the architecture’s upper boundary by proven failure. In enterprise performance testing, those ceilings are where the SLA stops being a forecast and becomes an autopsy.
Hosting Bottlenecks Under Load
Hosting bottlenecks under load are the specific resource-level constraints that emerge in an enterprise hosting environment when subjected to performance load tests. It represents the systemic resource failures that emerge when infrastructure is subjected to real-world concurrency and throughput tests.
Bottlenecks occur when system demand surpasses available capacity, producing observable degradation in test-phase metrics: elevated time to first byte, reduced throughput, increased latency, and rising error rates.
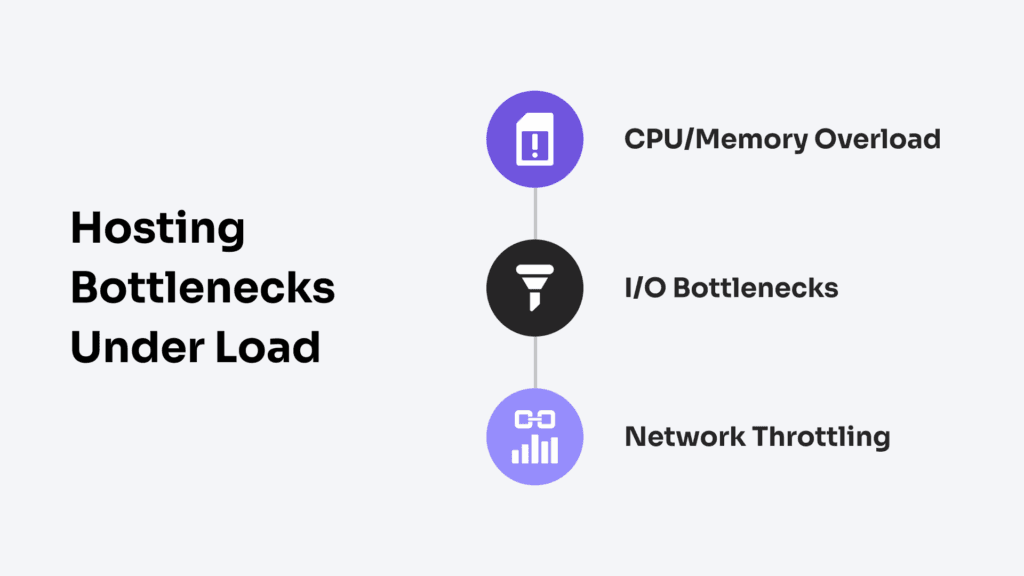
These bottlenecks fall into 3 primary categories: CPU/memory overload, disk I/O saturation, and network throttling. Each emerges under different load patterns but contributes to the same outcome: performance collapse. The failures are detected during performance test phases as cascading degradations in SLA-bound metrics.
CPU and memory overload appear early, often during spike test ramp-ups. When CPU usage sustains near 90%, thread pools block, queues grow, and garbage collection pauses introduce delays. This stalls response cycles and introduces memory overflow, which exacerbates garbage collection stalls and thread blocking.
This sequence defines a classic infrastructure bottleneck fingerprint. Test data typically shows latency jumps before errors appear, an early signal of compute exhaustion.
I/O bottlenecks are detected when storage subsystems saturate during high transactional throughput, triggering elevated disk latency and queue depth. Queue depth spikes beyond normal thresholds, especially on unsharded volumes or monolithic storage designs, causing slowdowns in dependent layers like application logic or reporting modules.
This response queue congestion leads to throughput collapse in downstream services, often surfacing in log traces before full failure.
Network throttling manifests as metric anomalies when bandwidth ceilings or NIC limits are exceeded under burst load conditions. This typically occurs under burst conditions, where throughput briefly exceeds available bandwidth.
Packet loss under load increases, causing timeout errors and failed inter-service communication. As a result, inter-service latency grows, and external API calls begin to fail, cascading across services.
Each bottleneck exposes SLA-violating latency origins and highlights architectural constraints such as single-threaded handlers, unsharded storage volumes, or shared NICs. They rarely act alone; CPU saturation slows GC, which delays I/O, which backs up request queues, triggering autoscaling, 503 error spikes, or full request collapse. These failures are fingerprints of systemic weakness, not anomalies. They define the real thresholds of enterprise hosting capacity.
CPU/Memory Overload
CPU and memory are a performance bottleneck condition where compute or memory resources are exhausted or saturated under test-induced load. An overload occurs when compute resources are unable to sustain concurrent request volume during load testing.
CPU saturation sets in above 90% utilization as thread pools max out, pushing execution queues to backlog and slowing response processing. Memory overload follows when allocated RAM is consumed faster than it’s released, triggering GC stalls, paging, or outright OOM kills.
Common triggers include high concurrency, blocking synchronous code, memory leaks or retained objects under load, large payload processing without async offloading, and resource-limited containers. These conditions surface when CPU usage stays above 90%, memory breaches container caps, and metrics like TTFB and page load time rise while throughput drops.
Error rates spike, typically 500s and 503s, due to hung threads or terminated processes. These errors correlate with sustained heap pressure and stalled garbage collection, particularly under concurrent request loads.
Overload effects compound: CPU saturation increases GC latency, GC delays raise memory pressure, and memory stalls delay request handling, creating a loop that degrades all test metrics observed during 1,000+ RPS stress tests. The system becomes unstable, with request latency remaining elevated and autoscaling lagging or failing entirely, even after traffic normalizes.
This failure mode exposes tier misalignment and resource provisioning gaps. It directly informs how hosting layers must be restructured to handle peak concurrency, not average load.
I/O Bottlenecks
I/O bottlenecks are performance degradation events triggered by the saturation or delay in data read/write operations across the hosting environment’s storage, database, and file systems. They occur when storage or data operations cannot sustain the required throughput during performance testing, leading to delayed responses and stalled execution threads.
Within enterprise hosting environments, I/O encompasses a broad range of operations critical to transactional and data-serving performance. This includes disk read/write throughput, file system access, and database commit cycles. I/O bottlenecks also contain interactions with data stores such as NoSQL or SQL backends, and telemetry writes like logging and session persistence.
Each layer introduces its own saturation points, any of which, once exceeded, introduce queuing, latency, and system-wide degradation.
Common bottleneck types include IOPS ceilings on cloud-attached volumes that flatline disk throughput once the maximum threshold is reached. In the database tier, saturation of connection pools and thread-blocking caused by long-running or unindexed queries under concurrency becomes a frequent bottleneck.
Similarly, shared or network-attached storage systems add latency due to access contention, while write-intensive operations, especially synchronous logging or caching layers, introduce blocking behavior under load. As these systems become overwhelmed, queue depths grow and I/O starvation surfaces, delaying transaction resolution. Queue depth often exceeds operational thresholds, commonly above 60 concurrent requests, causing transaction stalls and unserved threads.
These bottlenecks are explicitly reflected in test results. Load phases reliant on persistent storage operations often report response time inflation and commit lag. Throughput declines sharply during write-heavy test cycles as write latency compounds. Spike tests show abrupt drops in RPS as sudden demand outpaces the I/O layer’s response time budget.
Soak tests exacerbate the backlog, with queue saturation triggering thread stalls and unserved requests. Sustained write operations during soak testing often saturate connection pools and disk IOPS, exposing long-duration commit delays and forcing retry behavior. Timeouts, retry loops, and database error codes, such as HTTP 500s, become dominant error patterns. All these signals confirm the saturation point and scope of the I/O bottleneck.
Even horizontally scalable environments collapse when the data layer throttles. Compute node scaling fails to improve performance when threads stall, waiting for storage access or commit confirmation. The result is a plateau or collapse in throughput, decoupled from traffic scale.
This confirms that I/O saturation is a structural limitation. Identifying these limitations with clarity enables architectural tuning in follow-up stages, from caching rewrites to storage tiering, to re-establish data layer responsiveness.
Network Throttling
Network throttling is a bottleneck condition where the rate of data transfer is intentionally or automatically limited, resulting in slowdowns in application response, failed requests, and delayed asset delivery during performance testing.
It occurs when data transfer rates are limited by infrastructure policies or saturation, leading to latency and failed delivery under test load. Unlike application-layer slowdowns, network throttling is enforced through provider policies or interface saturation, creating fixed upper bounds regardless of available compute or storage.
Common causes include bandwidth caps (e.g., 1Gbps egress limits), cloud egress quotas, CDN or API gateway rate-limiting, and shared NIC contention in virtualized environments. During performance tests, these data rate caps are triggered early, especially under spike or burst load conditions.
In spike tests, burst traffic exceeds configured thresholds, activating rate policies that force 429 errors, TCP handshake delays, and DNS resolution lag. In soak tests, sustained usage gradually breaches egress quotas, leading to latent throttling that surfaces as increasing TTFB and asset delay without early indicators.
Test logs often show increased TTFB, delayed asset loads, and stagnant throughput even as RPS climbs. Observed retry loops and packet loss in logs confirm congestion at the CDN edge or virtual NIC interface. Enforcement typically occurs at CDN edges, VPC pipes, cloud routers, or service mesh layers, affecting both external delivery and internal service-to-service traffic. These enforcement points often apply rate limits silently, meaning test tools may only detect symptoms, like connection timeouts or delayed responses, after caps have already been exceeded.
For example, a CDN enforced a 1Gbps bandwidth cap during sustained load, resulting in a 12% degradation in asset delivery. A load balancer throttling at 800 RPS broke API throughput mid-test. These failures surface as latency spikes, degraded delivery metrics, and SLA violations, making network throttling a repeatable, infrastructure-level failure point in enterprise hosting under stress.
Hosting Optimization After Testing
Hosting optimization after testing involves the systematic refinement of infrastructure components to resolve bottlenecks and improve scalability. It follows performance testing not as an optional step, but as the operational response to failures surfaced under load.
Testing highlights where the enterprise hosting environment fails to meet expected performance thresholds, CPU exhaustion, memory saturation, I/O constraints, or network lag. Optimization remediates these test-identified thresholds by reconfiguring delivery mechanisms, tuning caching policies, and provisioning resources based on concurrency limits. Each fix must trace directly back to a test-observed failure and produce measurable improvement in TTFB, latency, or throughput.
The process begins with delivery and caching efficiency. CDN tuning reduces latency caused by edge fetch delays or asset routing inefficiencies. These adjustments reconfigure CDN edge node behavior, optimize origin shield routing, and increase static asset offload ratios to reduce cold start latency.
Caching strategy refinement addresses backend latency surfaced during spike and soak tests by tuning server-side cache policies and refining cache eviction logic. Optimization focuses on server-side cache behavior, object expiry control, and memory utilization.
For example, memory class realignment improved cache hit ratios by 35%, decreasing CPU load during repeated test scenarios.
When tuning and caching layers can no longer resolve throughput caps or concurrency faults, test-driven upgrade paths are triggered. These include vertical scaling across instance classes, horizontal container provisioning, and tier migrations, each aligned with observed IOPS ceilings, CPU-bound stalls, or memory leaks.
The hosting optimization process prioritizes low-cost, high-impact fixes, such as smarter routing and cache layering, before provisioning new compute resources. All changes are data-driven, outcome-bound, and aligned with the test-derived fault pattern.
Hosting optimization closes the performance loop, translating test-derived faults into measurable system gains and sustained SLA alignment.
CDN Tuning
CDN tuning is the set of configuration adjustments and performance refinements applied to a Content Delivery Network layer after performance testing identifies bottlenecks in asset delivery, latency, or geographic responsiveness. It targets delivery-layer inefficiencies exposed during hosting performance testing, reducing latency and improving asset delivery consistency.
In enterprise hosting architecture, the CDN layer absorbs edge requests to reduce origin fetch latency, optimize cache delivery, and stabilize geographic responsiveness. Performance testing commonly flags CDN-induced delivery failures through metrics like slow TTFB, elevated cache miss ratios, and inconsistent regional asset propagation.
Slow TTFB under load often traces to origin fetch delays. This is mitigated by enabling origin shielding, which absorbs edge cache fills and prevents backend overload. Cache miss penalties during traffic spikes typically signal short or misaligned TTLs. Adjusting cache duration based on content type improves hit ratio by aligning cache persistence with actual request frequency, especially under high concurrency.
When tests reveal geographic latency disparities, geo-load balancing is introduced to route traffic through optimal edge nodes. This tuning reduces latency variation between regions, which is frequently surfaced in testing through high standard deviation in TTFB across geographic locations. Prefetch and preconnect rules are applied to reduce initial connection time, directly improving TTFB under concurrency.
Heavy assets causing long load times are addressed by enforcing edge-side Brotli or Gzip compression. Cache key normalization corrects fragmentation, avoiding redundant entries that reduce hit efficiency. In cases of asset queueing, bundling or splitting critical files aligns delivery with rendering priorities. Edge rule customization enforces routing behavior under peak load, preventing erratic cache eviction and cold cache recovery scenarios that often degrade first-load performance after deployment events.
Each tuning step maps to a test-proven improvement. CDN log analysis confirms that origin shielding reduced fetch latency by 38% under a 1,000 RPS spike. Cache rule optimization raised the hit ratio from 42% to 88% during concurrency tests.
Geographic routing adjustments lowered TTFB deviation by 27% across test regions. These changes are revalidated through structured retesting and delivery log comparisons.
Caching Strategy
Caching strategy is the structured design and implementation of layered data retention mechanisms within the enterprise hosting environment, intended to reduce processing overhead, accelerate response time, and avoid redundant I/O and database calls during high concurrency.
This strategy is the deliberate selection and configuration of cache layers to reduce load-induced performance degradation. It addresses test-identified strain by retaining reusable content across memory, application, and storage layers, converting repetitive operations into low-latency fetches.
In-memory object caches like Redis reduce backend load during concurrent access by storing serialized data, often application responses or query results. When tests reveal CPU spikes from repeated computations, TTLs are extended for static entries, and LFU eviction replaces the default FIFO policy after spike test logs showed excessive memory churn under concurrent access.
Server-side page caching stores rendered output for static routes. It improves TTFB by serving prebuilt responses, bypassing render engines under load. After test-phase latency on key pages, cache warm-up is introduced, and dynamic bypass logic is enforced for endpoints prone to rapid change. Endpoints with volatile data were excluded from cache using response headers and custom route-based invalidation logic to prevent serving stale content.
Database query caching retains high-frequency result sets. When test logs expose DB saturation, result reuse is enabled on read-heavy endpoints with adaptive TTLs and invalidation only on table writes. Query logs confirm reduced call volume and stabilized response times. Query cache hit ratio under concurrency increased from 18% to 76% after TTL adjustment, confirming effective reuse and reduced DB query load.
Fragment caching captures partial templates, navigation, widgets, and repeated blocks to prevent redundant generation. Soak tests showing inconsistent page latency drive extraction and caching of stable components, tuned with session-aware keys and short expiry to avoid staleness.
Browser caching is enforced through adjusted HTTP headers. Asset revalidation patterns observed during spike tests are addressed by aligning cache-control and ETag policies for long-lived resources.
Each adjustment follows observed failures, reduced hit ratios, elevated eviction, or CPU overuse, and is confirmed by improved backend metrics. Caching strategy remediates resource pressure through structured retention, improving concurrency handling without requiring immediate tier upgrades.
Hosting Upgrade Paths
Hosting upgrade paths are the tactical, performance-driven migration and scaling decisions taken after testing uncovers resource ceilings, concurrency limits, or infrastructure breakdowns in the existing enterprise hosting setup.
An upgrade in enterprise hosting refers to measured changes in resource allocation or hosting model class made to resolve specific failure points exposed by load, stress, or soak tests. These upgrades include vertical scaling, horizontal scaling, tier migration, service-tier jumps, and architectural transitions, all triggered by concrete system bottlenecks.
During load testing, elevated garbage collection pauses and CPU stall rates indicated processing delays exceeding 800ms under 75% peak concurrency. Vertical scaling addresses such CPU and memory constraints by shifting to higher vCPU and RAM allocations. A 2 vCPU, 8GB node that fails under moderate load is replaced with a more capable class, typically 4 or 8 vCPU with increased memory, remediating GC delays and stabilizing throughput.
Spike tests revealed a 32% surge in 5xx errors beyond 1,000 concurrent sessions. Horizontal scaling resolves such throughput breakdowns by distributing load across additional instances or containers. New nodes are added behind a load balancer to eliminate single-point saturation and restore response consistency.
Performance logs showed disk queue lengths exceeding 300ms under soak test write bursts, surpassing the plan’s IOPS ceiling by 45%. Tier migration is used when infrastructure tiers can’t sustain required performance. A VPS plan collapsing under disk latency is migrated to a dedicated setup with higher IOPS provisioning.
Platform limits, such as Lambda function timeouts or container memory caps, also justify architecture-level transitions, e.g., moving from serverless to orchestrated containers. For example, Lambda-based functions hitting timeout limits during batch operations were transitioned to ECS Fargate containers to eliminate memory and runtime ceilings.
Latency spikes over 300ms were recorded in query response times under load, and cache miss rates exceeded 65%. Service-level upgrades are applied to the bandwidth, database, and cache layers. If tests reveal throttling at the network edge or lag from shared data stores, the stack is upgraded to higher-throughput, dedicated network tiers and distributed caches.
Each upgrade path is selected based on test-triggered thresholds. Prioritization is based on bottleneck severity, proximity to SLA breach, and system role in application stability. Hosting plan transitions, from shared to dedicated, or to multi-zone autoscaled environments, are made only when observed failures demand it.
After implementation, systems are retested against baseline metrics. CPU-bound scenarios must show GC pause reductions below 200ms. Load-balanced clusters must eliminate 5xx spikes under 1,200 concurrent users. Upgraded plans must sustain throughput above 1,000 RPS without latency regression.
Hosting upgrade paths resolve infrastructure failure modes exposed during hosting performance testing by executing targeted scaling actions that restore system reliability, concurrency tolerance, and throughput performance.

Contact
Don't like forms?
Shoot us an email at [email protected]