Web Analytics: Complete Guide

Table of Contents
Web analytics is the practice of measuring and interpreting user behavior, content performance, and technical conditions across a digital platform. It provides a structured data layer that supports decision-making by converting interaction records, traffic attributes, and system outputs into actionable insights.
In WordPress development workflows, web analytics integrates with event tracking, session measurement, and performance monitoring tools to evaluate how users navigate pages, engage with content, and complete conversion-oriented actions. These data flows supply developers and marketers with consistent feedback that guides UX adjustments, content refinement, and website performance optimization.
A WordPress environment enables web analytics frameworks to track session behavior, identify navigation patterns, analyze traffic sources, and monitor load performance. Through these operations, analytics systems move from raw data collection to structured reporting that clarifies engagement depth, friction points, and technical efficiency.
What is Web Analytics?
Web analytics is the process of collecting, classifying, and interpreting data on website interactions to understand how users navigate pages, consume content, and complete measurable actions. It converts raw events (such as clicks, scroll depth, and form interactions) into structured metrics that describe user activity and site performance.
A web analytics implementation relies on a measurement layer composed of data collection protocols, attribution rules, and reporting schemas. Through this layer, systems record events, assign them to sessions and pageview sequences, and organize them into dimensions and metrics that support user journey analysis, conversion tracking, and behavioral segmentation. Contextual attributes such as traffic source, device type, and content category refine these analyses and allow for targeted performance evaluation.
Web analytics functions independently of the underlying content management system. Platforms like WordPress integrate analytics through tagging scripts and measurement layers, but the analytical model itself remains platform-agnostic.
Types of Web Analytics

Behavior Analytics
Behavior analytics measures how users interact with a website during a session, focusing on actions rather than identity or acquisition source. It records clicks, scroll depth, hovers, and element-level interactions as event data, organizing these signals into navigation paths and engagement sequences that describe how users move through pages and respond to interface components. Within this scope, behavior analytics produces the behavioral dataset that supports user behavior analysis by quantifying interaction frequency, identifying friction points, and showing how users approach conversion steps.
Through session-level activity tracking, behavior analytics supplies data for UX evaluation, session replay systems, and behavioral flow reports. These outputs relate engagement patterns to outcomes such as form submissions or sign-ups, enabling marketing teams to refine information architecture, interface layout, and conversion paths. As part of the broader analytics stack, behavior analytics forms the operational foundation for correlating micro-interaction data with performance, content, and marketing metrics.
Performance Analytics
Performance analytics measures technical efficiency and responsiveness across a website’s infrastructure and rendering pipeline. It captures load time, rendering delay, server response characteristics, and code execution latency to quantify how pages load and respond under real conditions. This measurement layer evaluates how caching, rendering, and mobile responsiveness interact, enabling marketing teams to assess stability, uptime, and interface responsiveness.
Performance analytics identifies bottlenecks in page load execution, server-side processing, and frontend rendering by treating load behavior and backend operations as measurable attributes tied to user experience and system reliability. Its diagnostic outputs inform decisions about hosting environments, theme architecture, and plugin overhead. As part of long-term monitoring, Performance Analytics benchmarks site responsiveness over time, guiding optimization priorities and supporting retention-focused usability improvements.
Content Analytics
Content analytics evaluates how website content (pages, articles, and structured blocks) is viewed and consumed. It measures visibility, scroll depth, read-time metrics, and interaction patterns at the element level to determine how users progress through each page’s structure. By analyzing consumption thresholds and engagement around specific components, content analytics identifies which assets support user understanding and which require structural revision.
This analytic layer relates content performance to template hierarchy, internal navigation signals, and block placement, exposing how layout choices influence engagement. Its insights support editorial planning and content structure decisions by aligning page organization with user expectations and informational needs. The resulting feedback loops guide decisions on content creation, placement, and redesign to ensure content effectively contributes to site goals and user journeys.
SEO Analytics
SEO Analytics measures a site’s organic visibility by tracking how pages are indexed, displayed, and interacted with in search results. It records SERP positions, impression trends, organic click behavior, index coverage, canonical status, and crawl activity to assess how well site structure and content support discoverability and query alignment.
This layer monitors ranking fluctuations and crawl budget allocation, connecting these signals to internal structure, taxonomy integrity, and technical SEO compliance. SEO analytics informs adjustments to internal linking, sitemap quality, and content organization by showing how search engines interact with templates and modular content. Its insights ensure that structural and semantic choices remain aligned with long-term organic performance.
Marketing & Attribution Analytics
Marketing & attribution analytics is the combined measurement framework that evaluates channel performance and assigns value to touchpoints along a user journey. Marketing analytics captures campaign-level data such as traffic segments, acquisition channels, and conversion triggers, while Attribution Analytics models how value is distributed across interaction sequences leading to a conversion. Together, they map assisted conversions, multi-session paths, and channel contribution patterns.
This framework analyzes how traffic composition, campaign structures, and sequential interactions influence outcomes. Attribution models (spanning email, paid, organic, and referral channels) explain how touchpoints affect funnel progression and support strategic decisions about channel investment and optimization. In modular website environments where landing pages, plugins, and acquisition paths intersect, this analytic layer connects campaign data to UX and content decisions, complementing resources such as a lead generation guide by grounding acquisition strategy in measurable cross-channel evidence.
What Are the Core Components of Web Analytics Systems?
Core components of web analytics systems are the data entities that determine how user interactions are collected, organized, and measured within an analytical model. These components include users, sessions, events, dimensions, and metrics.

Users
Users are the top-level analytic component in a web analytics system and serve as the unique identities to which all interaction data is assigned. Each user is identified through a persistent identifier that links multiple sessions and events to the same source. This identity structure prevents interactions from being treated as isolated records and enables consistent aggregation of behavioral activity. As the highest component in the system, the user record establishes cross-session continuity and supports long-term engagement analysis.
Sessions
Sessions are time-bounded data components that group all user interactions occurring within a defined activity window. A session begins when the first event is recorded for a user, establishing the initial timestamp that anchors subsequent interactions. The session ends after a defined period of inactivity, commonly measured as a fixed time threshold with no additional events recorded (for example, 30 minutes of inactivity in some analytics systems). However, this threshold can vary by platform and configuration.
Events
Events are discrete records of user actions, representing the most granular behavioral component in a web analytics system. Each event is timestamped and includes a defined event name and parameter set, allowing the system to capture context such as interaction type, location, or triggered outcome. Events occur within sessions and are associated with a specific user, forming the action-level dataset from which metrics, funnels, and behavioral flow analyses are derived. They define the operational activity layer of the analytics system.
Dimensions
Dimensions are descriptive attributes used to classify and contextualize user, session, and event data. They function as non-numeric variables (such as device type, traffic source, or content category) that segment records into meaningful groups. Within the data model, dimensions provide the categorical structure through which metrics can be compared, filtered, and interpreted. By describing entity properties, dimensions ensure that quantitative values reflect relevant analytical contexts.
Metrics
Metrics are quantitative measurements that summarize behavior and performance in a web analytics system. Derived from raw event data, metrics include counts, durations, frequencies, and calculated performance indicators. Metrics are interpreted through dimensions, which segment results into comparable analytical slices. As the primary evaluative outputs, metrics enable monitoring, trend analysis, and performance assessment across users, sessions, and events, completing the core measurement layer of the analytics model.
Key Web Analytics Metrics
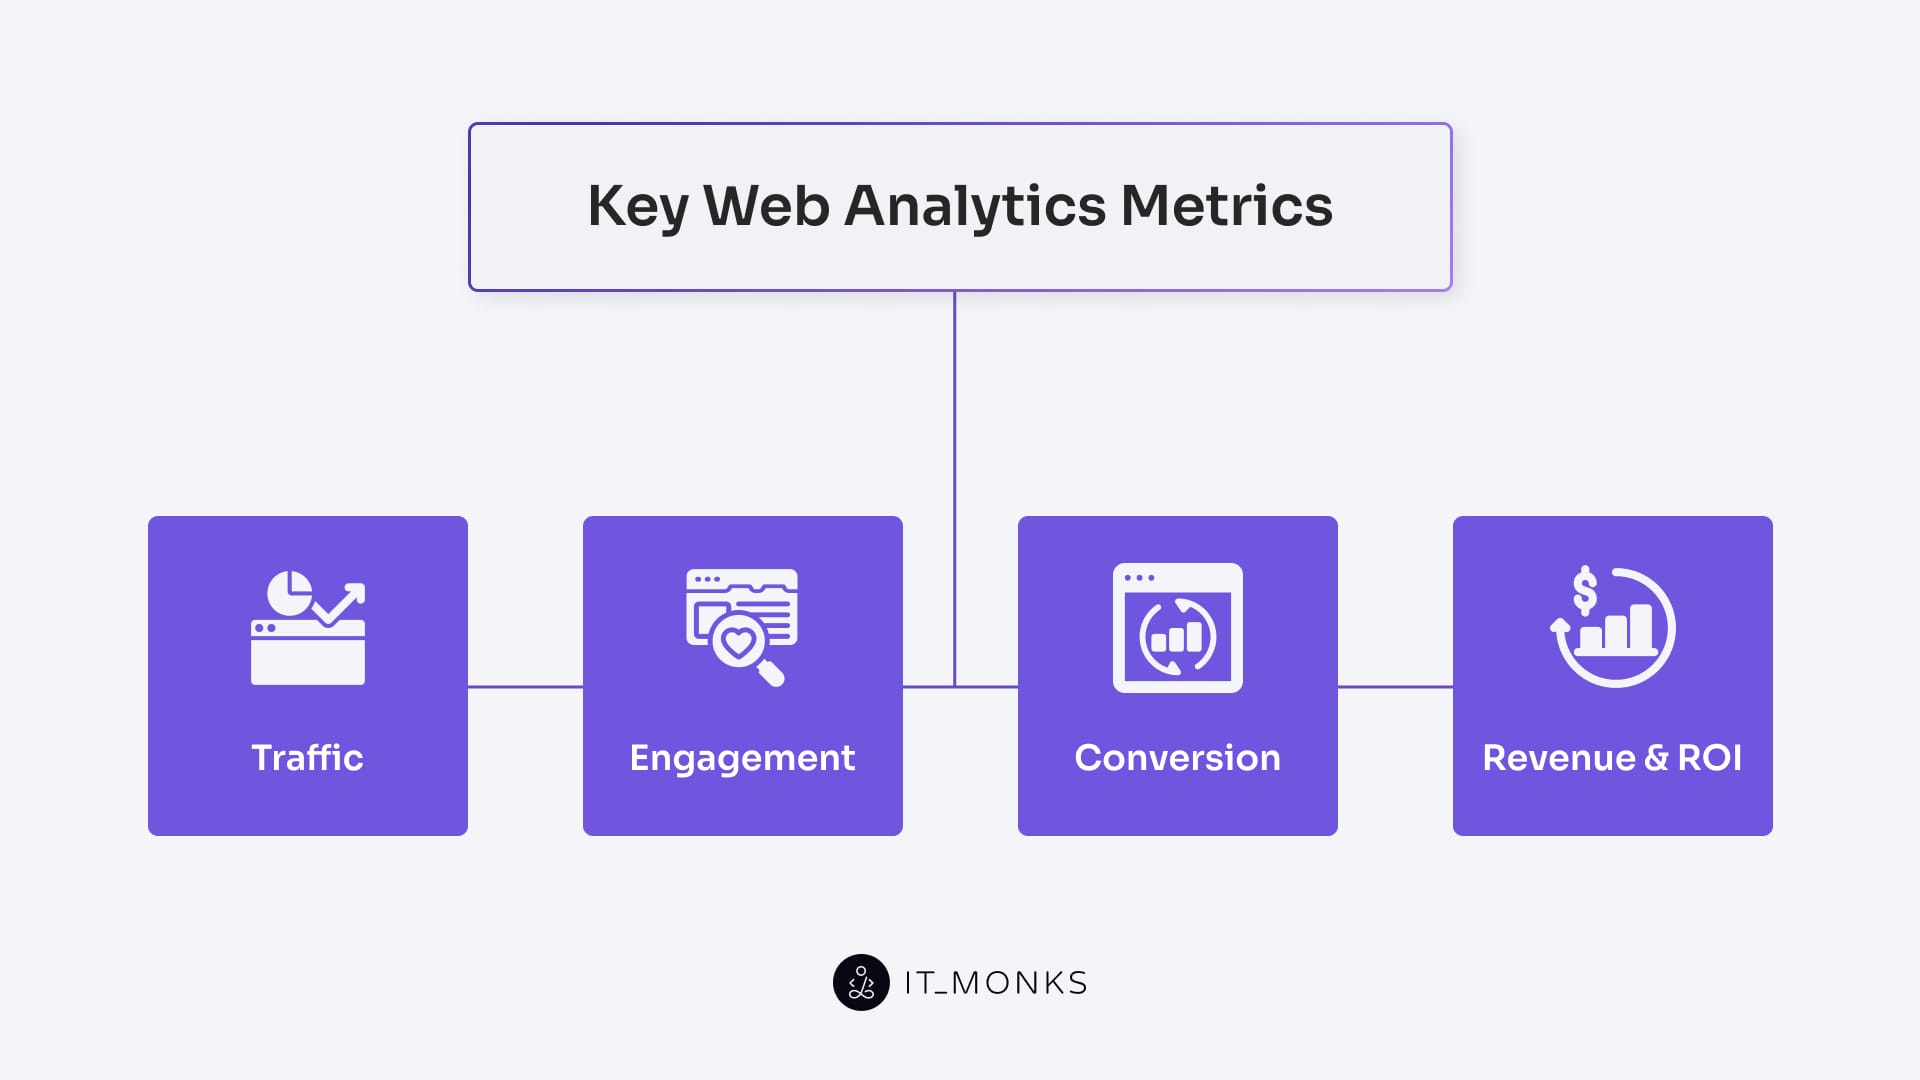
Key web analytics metrics include traffic, engagement, conversion, revenue & ROI, which are quantitative indicators that measure user behavior, system performance, and outcomes in a digital environment. Derived from event data, these metrics form the numerical layer of web analytics, providing standardized values that quantify interaction volume, engagement quality, and goal completion. By translating raw event streams into measurable outputs, metrics enable consistent evaluation of how a website performs and how effectively its objectives are achieved across technical, design, and strategic dimensions.
Traffic Metrics
Traffic metrics are volume-based indicators that measure how many users access a website and how inbound traffic is distributed across acquisition sources and channels. They quantify entry counts, track source composition, and show how visibility changes over time. By segmenting access patterns by channel, device, or campaign, traffic metrics provide the baseline context needed to interpret engagement, conversion, and revenue performance in subsequent analyses.
Engagement Metrics
Engagement metrics are behavioral indicators that measure the depth and continuity of user interactions within a session. They quantify event frequency, navigation activity, and interaction duration to distinguish brief visits from sessions with meaningful engagement. Derived from session and event data, engagement metrics describe how users interact with content and interface elements, providing the analytical basis for evaluating behavioral quality before goal completion.
Conversion Metrics
Conversion metrics are goal-based indicators that measure when users complete predefined actions such as sign-ups, form submissions, or purchases. These metrics originate from event sequences linked to specific objectives and quantify how effectively users progress through conversion paths. By describing goal completion and funnel performance, conversion metrics support outcome evaluation and diagnostics across user segments. When used alongside optimization processes (such as those detailed in a converion rate optimization guide), they help interpret how interaction patterns translate into measurable results.
Revenue & ROI Metrics
Revenue & ROI metrics are financial indicators that measure the monetary outcomes of conversion activity and evaluate the efficiency of associated costs. Revenue metrics quantify transaction value and other monetized outcomes derived from event data, while ROI metrics calculate the ratio of financial return to investment. Together, they form the economic layer of web analytics, connecting user actions to business impact and supporting decisions on budget allocation, performance evaluation, and long-term digital strategy.
Web Analytics Data Collection
Web analytics data collection is the process that gathers interaction signals, technical attributes, and behavioral events through tracking scripts and tags, tag management systems, and consent and privacy layers, forming the raw input for all analytics operations. It captures data in a consistent format that supports the identification of users, sessions, and events, ensuring that all subsequent measurements originate from a reliable ingestion process.
Tracking Scripts and Tags
Tracking scripts and tags are the core components that capture interaction data on a website. A tracking script is executable code that runs on page load or user interaction and initiates event recording. When triggered, scripts call tags, defined logic units that collect event parameters, assemble payloads, and transmit the data to analytics endpoints. In this structure, scripts execute the tracking logic, and tags package and send the recorded information.
Together, tracking scripts and tags establish the first stage of data collection. They record interaction signals but rely on higher-level systems (such as tag management frameworks and consent layers) to control when and how tracking executes. Their output forms the initial event stream that supports downstream processes such as session construction, metric calculation, and behavioral segmentation.
Tag Management Systems
Tag management systems (TMS) are centralized control environments that manage the deployment and execution of tracking scripts and tags across a digital property. A TMS defines when tags fire, which conditions activate them, and how event logic is routed based on page context, user state, or trigger rules. By separating tracking configuration from site code, a TMS keeps analytics implementations modular and maintainable.
Within the collection layer, the TMS provides unified control over tag firing behavior, execution order, and governance rules. It also integrates with consent mechanisms to ensure that tag activation complies with user permissions. As implementations expand, the TMS coordinates all tracking activities to maintain accurate data flow and consistent logic across events, sessions, and users.
Consent and Privacy Layers
Consent and privacy layers are governance components that determine whether tracking logic may execute based on user permissions and regulatory requirements. Before scripts or tags run, the consent layer checks the user’s consent status, while the privacy layer restricts which data fields may be collected or transmitted. Together, they control whether tracking actions are allowed and what information may be processed.
Integrated with the TMS, these layers enforce compliance by enabling or blocking tag execution according to consent selections and privacy rules. They act as decision filters, ensuring only permitted data enters the analytics system. By regulating data access in real time, Consent and Privacy Layers maintain lawful operation and protect data integrity across all subsequent analytical processes.
Tools Used in Web Analytics
General Analytics Platforms
General analytics platforms are central systems that process data from users, sessions, and events to produce structured metrics for reporting and analysis. They aggregate raw data captured through scripts, tags, and collection layers, then model user behavior and site performance into standardized indicators such as traffic, engagement, conversions, and revenue. These platforms provide queryable, visualized outputs that support trend analysis, anomaly detection, and performance evaluation.
Common platform-level solutions include Google Analytics 4, Adobe Analytics, Matomo, and Plausible, each providing consolidated measurement and reporting capabilities across user journeys.
Heat Maps
Heat maps are visual tools that display interaction intensity on web pages by mapping where users click, scroll, hover, or tap. They overlay interaction data onto the page structure, revealing spatial patterns of high-attention areas, low-engagement regions, and potential friction points. By converting raw interaction data into a position-based visualization, Heat Maps help assess how layout, element placement, and content structure influence user behavior. They complement general analytics platforms by offering spatial insight that numeric reports cannot provide, with further guidance available in a heat map guide.
Session Recording Tools
Session recording tools capture session-level user activity and reconstruct it as event-based playback sequences. Instead of storing video, they log discrete interaction events (such as clicks, scrolls, field entries, and navigation steps) and replay them to show how users moved through the interface. This reconstruction enables analysts to examine interaction flow, identify points of hesitation, and verify how users progress through pages. As part of the analytics stack, session recording tools provide granular behavioral context that complements aggregate metrics and static visualizations.
Dashboarding and BI Tools
Dashboarding and BI Tools are visualization environments that connect to analytics data sources and present processed metrics through interactive dashboards and reports. Operating at the interpretation layer, these tools consolidate traffic, engagement, conversion, and revenue indicators into structured views that support KPI monitoring and performance evaluation. They enable cross-metric comparisons, trend tracking, and exploratory analysis without modifying underlying measurement logic. Within the analytics framework, Dashboarding and BI Tools function as the reporting interface used for operational oversight and strategic decision-making.
Log-Based and Server-Side Analytics
Log-based and server-side analytics are backend measurement approaches that collect interaction and performance data directly from server logs, API activity, and backend tracking logic rather than from client-side scripts. Log-based systems process server logs to extract request patterns, response behavior, user agents, and navigation paths. Server-side analytics extends this approach by capturing events through backend processes (such as API-triggered tracking or server-side event dispatching) independent of browser execution. These methods remain reliable even when client-side tracking is blocked or restricted, providing a privacy-resilient, infrastructure-level data source that supports and complements front-end web analytics.
How to Set Up Web Analytics in WordPress?
Setting up web analytics in WordPress requires integrating a site-wide tracking system that reliably captures user interactions, content engagement, and technical performance across all pages and templates. Because WordPress operates as a dynamic CMS, where posts, taxonomies, and layouts change over time, the analytics implementation must remain persistent across the theme structure rather than operate as a temporary add-on.
Within WordPress, analytics setup supports ongoing evaluation by recording events, sessions, and traffic patterns that show how users navigate, interact with content, and complete defined actions. These measurements provide the data needed to refine page layout, adjust navigation paths, and prioritize functional updates based on observed behavior rather than assumptions.
A complete integration follows a layered approach.
- The tracking layer embeds client-side or server-side logic within themes and templates to record events.
- The measurement layer processes these signals into user, session, and metric data tied to WordPress content structures.
- The interpretation layer analyzes the resulting data and informs decisions about content placement, UX adjustments, and performance optimization.


Contact
Don't like forms?
Shoot us an email at [email protected]